Investment Thesis: Transparency Global believes transparent companies – as measured by the six key performance Indicators of transparency – have less friction, superior cultures, greater innovation and creates impact that results in higher level growth.
Growth Potential: The Transparency Index tracks the top 100 transparent companies in the world. Transparency Global believes that transparency is a catalyst for impact and growth that is set to transform industries.
Index Classification: Thematic Impact Investing
Starting with a universe of 55 thousand global equity securities, the Transparency Index consists of 100 most transparent companies in the world derived by applying the Six Key Performance Indicators of Transparency. The index is composed of equity securities and ADRs listed on US stock exchanges ( NYSE, NASDAQ and AMEX).
| TOP 10 HOLDINGS | ||
|---|---|---|
|
As of March 31, 2022 |
||
|
|
COMPANY |
WEIGHT |
|
1 |
AEROVIRONMENT, INC. |
1.81% |
|
2 |
SPLUNK, INC. |
1.53% |
|
3 |
PEARSON PLC
|
1.44% |
|
4 |
NATURA & CO HOLDINGS |
1.40% |
|
5 |
CANADIAN SOLAR |
1.35% |
|
6 |
CROWDSTRIKE HOLDINGS, INC. |
1.32% |
|
7 |
SONOCO PRODUCTS COMPANY |
1.30% |
|
8 |
CHARGEPOINT HOLDINGS, INC. |
1.24% |
|
9 |
QUALYS, INC. |
1.24% |
|
10 |
MCCORMICK & COMPANY, INC. |
1.23% |
Holdings are subject to change. Index holdings should not be considered as investment advice or a recommendation to buy, sell or hold any particular security. It should not be assumed that an investment in the securities identified was or will be profitable. Index weights will be reweighted at the end of each quarter on the rebalancing date back to a 1% weighting for each index constituent.
| INDEX DETAILS | |
|---|---|
|
As of March 31, 2022 |
|
|
INDEX NAME |
Transparency Index |
|
ISIN |
DE000SL0DL14 |
|
INDEX LISTINGS |
Bloomberg and Reuters |
|
BLOOMBERG TICKER |
TRANSPCY Index |
|
RIC |
.TRANSPCY |
|
INCEPTION DATE |
06.16.2021 |
|
INDEX MANAGEMENT |
Passive |
|
AVERAGE MARKET CAP |
$92.88 Billion
|
|
MEDIAN MARKET CAP |
$10.37 Billion |
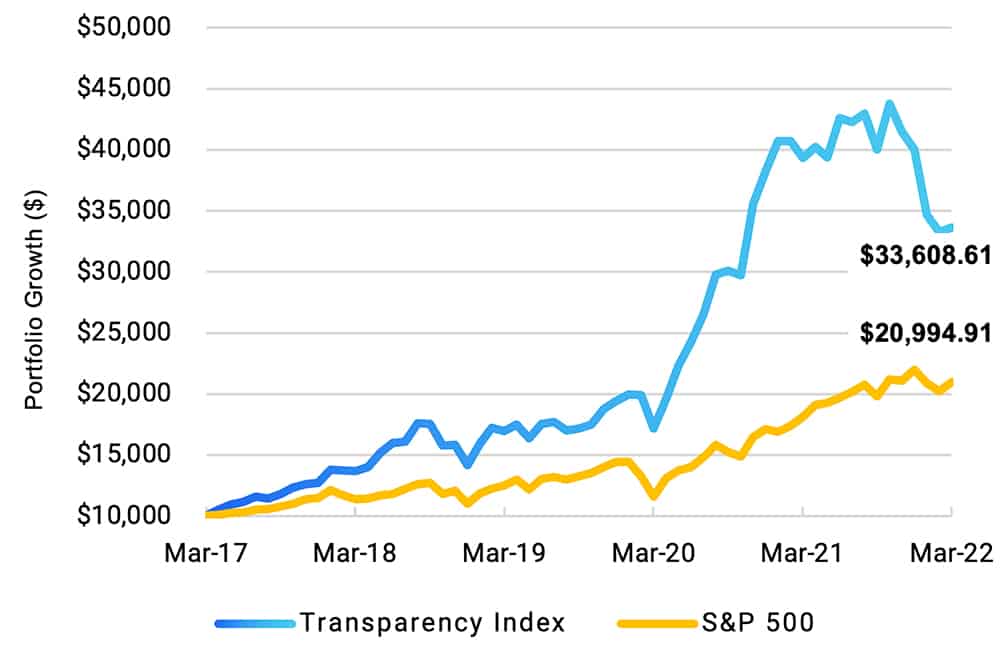
The graph shows cumulative returns for the period from April 1, 2017 to March 31, 2022. Starting value $10,000 hypothetical investment, assuming no withdrawal and no dividends. Using an archive back test, the number of transparent companies varied each year beginning in 2016. As such, the monthly returns were calculated for the number of transparent companies available in each year until June 30, 2021. Beginning on July 1, 2021, the monthly returns from the live index were included as part of annual return calculation.
| INDEX PERFORMANCE | ||||
|---|---|---|---|---|
|
As of March 31, 2022 |
||||
|
|
1YR |
3YR |
5YR |
|
|
Transparency Index™ |
-14.51% |
25.6% |
27.44% |
|
|
S&P 500 |
15.65% |
18.93% |
15.99% |
|
The annual return performance presented is the back-tested performance. Beginning on July 1, 2021, the monthly returns from the live index were included as part of annual return calculation. Annual Returns shown before the index launch date reflect hypothetical historical performance. Please see disclaimer for important legal information. Data source for S&P 500 is S&P Global Inc.
| MARKET CAPITALIZATION | |
|---|---|
|
As of March 31, 2022 |
|
|
Mega ($100B+) |
12.19% |
|
Large ($10 – $100B) |
39.96% |
|
Medium ($2 – $10B) |
37.61% |
|
Small ($300M – $2B) |
13.24% |
| SECTOR BREAKDOWN | |
|---|---|
|
As of March 31, 2022 |
|
|
Communication Services |
6.31% |
|
Consumer Discretionary |
21.90% |
|
Consumer Staples |
4.56% |
|
Financials |
1.79% |
|
Healthcare |
7.41% |
|
Industrial |
9.82% |
|
Information Technology |
45.99% |
|
Materials |
2.22% |
Sector Breakdown is based on Global Industry Classification Standard (GICS).
| GEOGRAPHIC BREAKDOWN | |
|---|---|
|
As of March 31, 2022 |
|
|
North America |
85.46% |
|
Western Europe |
6.84% |
|
Asia Pacific |
3.60% |
|
Emerging Markets |
2.40% |
|
Africa/Middle East |
1.71% |
| SUMMARY OF INDEX METHODOLOGY | |
|---|---|
|
INDEX CLASSIFICATION |
Thematic Impact Investing |
|
SELECTION UNIVERSE |
Global Equities |
|
Minimum Market Cap |
$3 Billion |
|
IPO Criteria |
One Calendar Year Publicly Traded |
|
Listed Exchanges |
NYSE, NASDAQ, AMEX (ADRS) |
|
Revenue |
No pre-revenue companies |
|
Security Selection |
Rules Based |
|
6 Factors of Transparency1 |
Transparency Benchmarks, Terms, Accountability, Cost, Truth, Trust |
|
Index Management |
Passive |
|
Number of Constituents |
100 |
|
Rebalancing |
Quarterly: March, June, September and December: Last business day of each quarter |
|
Portfolio Weighting |
Equally Weighted Portfolio, 1% |
|
Excluded Industries |
Alcohol, Banking, Chemical, Confectionary, Fossil Fuel Transportation, Gambling, Metals & Minerals, Oil & Natural Gas and Tobacco |
| Transparency Index vs S&P 500 | |||
|---|---|---|---|
|
As of March 31, 2022 |
|||
|
Company Overlap1 |
5.20% |
|
|
|
5 Year CAGR2
|
27% |
16% |
|
|
Average Market Cap3 |
$93B |
$80B |
|
|
International Exposure4 |
18% |
4% |
|
|
Tracking Error5 |
11% |
|
|
|
Correlation6 |
0.74 |
|
|
|
Revenue Growth7 |
+12.04% |
+9.41% |
|
|
Excluded Companies8 (Companies from 9 Excluded Industries) |
|
157 |
|
The Standard & Poor’s (S&P) 500 Index is an index consisting of the 500 largest US publicly traded companies. The S&P 500 Index is weighted by market cap.
8
Sectors
35
Industries*
$93B
Avg. Market Cap
Equally Weighted
Portfolio: 1%*
82% Domestic
18% International*

Index Calculation
Transparency Global has contracted with Solactive AG to maintain the Index rules and methodology, calculate the Index and disseminate information about the Index including the performance shown herein. Solactive does not manage actual assets. The Index is unmanaged, which means that the companies included in the Index are selected automatically according to a proprietary algorithm of Transparency Global that serves as the basis of the Index methodology. The Index is equal-weighted, which means that the 100 companies included in the Index each represents approximately 1% of the Index – with variations due to market performance. Solactive rebalances the Index back to a 1% weight for each index constituent at the end of every quarter/3 months using the Index methodology explained herein.
The Index and the performance shown herein to do not reflect the payment of any sales charges or fees that an investor may pay to purchase the securities underlying the Index or the securities of any investment funds that seek to track the performance of the Index. The imposition of such fees and charges would cause actual and back-tested performance of the securities/fund to be lower than the Index performance shown. Additional details regarding the calculation of the Index are available by contacting Solactive AG.
Company
Transparency Global operates a digital platform accelerating the world’s adoption of Transparency. The platform includes certifications, rankings, research, education, surveys and a financial index. Transparency Global certifies companies that meet the highest levels of organizational transparency analyzing over 60,000 globally traded public companies creating the world’s largest Transparency database of both public and private companies.
Back-Tested Performance
The Transparency Index (“the Index”) commenced on June 16th, 2021 following the market close. All information presented prior to this date is backtested. Back-tested performance is hypothetical performance, not actual performance. Back-tested performance is prepared by retrospectively applying the Index methodology to historical information with the benefit of hindsight. Back-tested performance, therefore, does not reflect the results of actual trading. Back-tested, as well as actual performance, are not indicative of future results. The back-tested performance uses the same methodology that was in effect when the Index officially launched on June 16th, 2021. The back-tested performance shown in this presentation is unaudited and does not reflect the investment of dividends or other earnings. The Index does not reflect the reinvestment of dividends.
Using an archive back test, the number of transparent companies varied each year beginning in 2016. As such, the monthly returns were calculated for the number of transparent companies available in each year until June 30, 2021. Beginning on July 1, 2021, the monthly returns from the live index were included as part of annual return calculation. As a result of the archive backtest, the number of companies available at the beginning of each year was: 43 companies – 2016, 46 companies –2017, 51 companies – 2018, 64 companies – 2019 , 83 companies – 2020, 100 companies – 2021, 100 companies – 2022.
The index methodology does not overweight or underweight any particular industry, sector or geography. All KPIs are equally weighted. Company selection into the index is based on the level of organizational transparency as quantified by the 6 Factors of Transparency. Examples of reasons why companies did not make the index include: 1. factors score less than 60%; 2. Market cap less than $3 billion on a 30-day moving average basis; 3. No company website; 4. In an excluded industry; 5. Not listed on a U.S stock exchange; and 6. Not yet IPOed or IPOed less than 1 calendar year.
Transparency Index™ Powered Using Refinitiv Data
Filtering out industries that do not align with a positive impact on investment performance. well-being of people. the environment.
6 Factors of Transparency

Easy to understand rules leading to high levels of transparency.

Ridiculously simple customer contract.

High quality governance.
Definable consequences.
Adherence to standards and terms.

Complete and total cost.
No hidden fees.
Simple to understand.

Open, accurate, data-based
communication of facts.

Complete consumer loyalty.
Exponential transparency.