This paper aims to determine the extent to which publicly traded firms that pursue voluntary nonfinancial transparency deliver greater shared environmental, social, and governance (ESG) value than less transparent peers. Financial and ESG disclosures were obtained via Refinitiv for 2,295 companies with the largest capitalization in the United States during the third quarter of 2019. Companies listed in Transparency’s Transparency Index were treated as “most transparent.” Those creating Sustainability, Corporate Social Responsibility (CSR), Global Reporting Initiative or United Nations Global Compact (UNGC) ESG reports were deemed “transparent;” with remaining firms considered “nontransparent.” To identify significant differences in ESG value across these groups, standard graphical, parametric, and nonparametric methods were applied to a set of internationally recognized adverse and beneficial ESG metrics, respectively aligned with Europe’s Sustainable Finance Disclosure Regulation (SFDR) and the UN Sustainable Development Goals (SDGs).
The most transparent US-listed companies performed better than the rest with respect to certain adverse ESG metrics. Accounting for market capitalization and revenue, most transparent companies had significantly lower greenhouse gas emissions (GHGs) than less transparent peers. A greater proportion of Transparency Index firms used renewable energy. More had policies associated with proactive human rights practices and fair labor. Their corporate boards also included more women (26%) than others (22%). Unlike peers, a clear majority of the Transparency Index produced CSR sustainability reports. Nonetheless, they were no more likely than their peers to support any globally beneficial UN SDGs. Thus, immediately prior to COVID-19, the most transparent companies demonstrated greater ESG risk mitigation but had yet to distinguish themselves with respect to pursuit of universal ESG opportunities or global societal benefits. Applying methods here to increasingly standardized ESG disclosures across various stock markets of the 2020s may reveal further emergent causal connections between exemplary transparent corporations and their shared ESG value for our pandemic-transformed world.
Sustainable development promises that all of humanity will soon thrive together in perpetuity (UNGA, 2015). This vision was profoundly challenged by the first ubiquitous pandemic of the 21st century. As COVID-19 disrupted economies, governments and societies, stakeholder capitalists like Blackrock CEO Larry Fink (2022) called upon the private sector to step up and help society:
We ask businesses to demonstrate how they’re [sic] going to deliver on their responsibility to shareholders, including through sound environmental, social, and governance [ESG] practices and policies.
How should businesses do so?
Prior to this global crisis, prescient sustainability practitioners in government, industry, and other sectors increasingly collaborated toward creating conditions to enable all of humanity to thrive: Our Common Future established how interconnected challenges of environmental stewardship and socio-economic development necessitate a holistic approach to global problem-solving (WCED, 1987). John Elkington (1997) popularized one such approach, applying business acumen to secure and sustain a “triple bottom line” (TBL) for people, prosperity, and planet. That is, meeting human needs and rights, ensuring economic growth and equity, and fostering perpetuation of life-supporting ecosystem goods and services. How can businesses operationalize this pursuit?
“One practice is essential to moving any organization’s ESG goals forward: transparency,” asserted Accenture’s Jill Standish (2021).
The present study adopted David L. Rainey’s (2010) definition that transparency is “open disclosure and reporting of social, economic, and environmental performance, including information about products, processes, practices, and the underlying premises and scientific principles.” Standish, Yu (2018), Cort and Esty (2020), and others have emphasized that transparency can be good for one’s financial bottom line. Transparency also plays a vital role in reducing information asymmetries, revealing inefficiencies and inequities, and inspiring innovation needed to transform our world.
The Global Reporting Initiative represents one common, elaborate framework to operationalize transparency. GRI launched 25 years ago to create a universal framework for businesses to systematically disclose and track progress toward realizing the TBL. Its 34 topical standards are organized into three series, based on the TBL. Topics in each series vary from Procurement Practices to Biodiversity to Child Labor. Disclosures within each topic may span impacts both private (internal risks and opportunities) and public (external costs and benefits).
Today’s GRI Standards “deliver the highest level of transparency for impacts on the economy, environment and people.” Related frameworks are more limited in scope: SASB focuses on nonfinancial risk mitigation, while CDP and TCFD historically target climate-change-related disclosures. Thus, understandably, the World Economic Forum (2020) relied most heavily on GRI disclosures for its own corporate sustainability reporting guidance.
In 2021, when 95% of S&P 500 corporations produced and posted their ESG disclosures online, two thirds referenced GRI in their financially integrated reports or standalone ESG reports (Center for Audit Quality, 2021). Still, these large companies’ transparency was historically unbalanced—they were most transparent for governance disclosures and least transparent for environmental disclosures (Tamimi & Sebastianelli 2017). Furthermore, market capitalization and governance factors like corporate board gender diversity appeared to influence the degree of ESG disclosure. Consequently, smaller firms may avoid complicated transparency frameworks like GRI altogether, instead opting either to align their ESG disclosures with a simpler framework, such as introduced below, to create their own homegrown corporate social responsibility and sustainability (CSRS) reports or to forgo regular ESG disclosures entirely. While the last, “nontransparent” group above might be expected to demonstrate the least TBL success, it is unclear a priori whether GRI or a simpler transparency framework would correspond to the most successful TBL outcomes.
International agencies have recruited businesses to contribute to shared TBL value. For instance, the United Nations Global Compact bills itself “the world’s largest corporate sustainability initiative,” with over 19,000 member organizations across 160+ nations. UNGC specifically calls on companies to align business strategies and operations with 10 universal ESG principles to promote human rights, labor, environment, and anti-corruption, while regularly acting and reporting progress to advance practice of these principles. UNGC also actively facilitates corporate commitments to help realize the United Nation’s 17 Global Goals for 2030 (a.k.a., the Sustainable Development Goals). The extent to which a company supports humanity’s pursuit of one or more of these SDGs could be a useful indicator of the public benefits firm leaders envision or seek to create.
The European Securities and Markets Authority’s (2021) Sustainable Finance Disclosure Regulation (SFDR) established the first international requirements for corporate ESG transparency. This rule mandates regular reporting of a set of “principal adverse [sustainability] indicators” (PAIs), risk-focused disclosures addressing:
This standardized set of PAIs applies to all ESG investments throughout the European Union. That vast coverage, in turn, provides a pervasive transparency framework to guide creation of shared value through joint mitigation of private risk and public costs. Thus, SFDR disclosures offer support to TBL transformations in Europe and beyond. Deckelbaum et al. (2022) indicate Americans’ counterpart is under development.) Since SFDR reporting began so recently, however, the 14 PAIs are not used here as a comparison group but instead as a model for comparing TBL impacts across voluntary disclosure frameworks.
The ultimate disclosure framework examined here was Transparency’s Transparency Index (TI) of the “top 100 most transparent companies in the world.” This index does not explicitly measure typical ESG metrics. Instead, it excludes firms without revenues and industries that do not align with a positive impact on investment performance (first bottom line of TBL), peoples’ well-being (second bottom line) or the planet (third bottom line). US-listed firms passing these screens were then rated and ranked according to their scores across six Key Performance Indicators (KPIs), described in the Methods section below.
The Transparency Index of exceptionally transparent stocks outperformed a passive index (Russell 1000) of comparable market capitalization (+34% vs. +12%) over the five years ending Sept. 30, 2021. How does Transparency Index firms’ nonfinancial ESG performance compare to that of less transparent peers of similar market capitalization?
Unlike many conventional ESG indexes, the Transparency Index does not subjectively manipulate the relative weights of its rating criteria by company or industry to maximize ESG features or to emulate the financial profile and investment returns of a non-ESG counterpart. This index’s designers respected that nature disregards what a company buys or sells, reacting only to what is extracted from or discarded into the environment, which makes the Transparency Index more accessible to examining whether its unweighted thematic transparency disclosures result in real-world TBL benefits for shareholders and other stakeholders. Thus, we can respond analytically to social contract questions like, “Does corporate transparency contribute to sustainability benefits for society at large?”
The Transparency Index is equally well-structured to test Standish’s (2021) assertion that greater governance transparency fosters greater governance performance, along with co-benefits to environmental and social aspects of ESG. The current study could also provide evidence to support the author’s perspective that a transparent mindset and transparent culture can create co-benefits beyond the specific focus of corporate disclosure. For example, when businesses create standards documents for equity or human rights, they may be more likely to foster an ethical culture in their workplace. This concept may also apply to a company’s impact: building robust sustainability infrastructure or strict supply chain management standards may catalyze staff to anticipate and prepare for looming global regulation of ESG disclosures. Lastly, the author intends to explore the notion that with great transparency comes great impact.
Can corporate transparency create shared ESG value to foster societal benefit? The next section introduces our study design and methods to address this line of inquiry. Results present which kind(s) of transparency disclosures—Transparency Index, GRI Standards, UNGC updates, and/or custom-made sustainability reports—distinguish themselves from the status quo of nontransparent peers’ ESG performance and TBL impact. Discussion will then return to the big picture: How to apply this study’s findings and make recommendations regarding whether or how greater transparency can improve ESG outcomes.
Our methodology involved searching for significant statistical relationships between internally developed transparency indicators and internationally recognized indicators of ESG risks and opportunities. Using data provided by Refinitiv, we selected adverse and beneficial ESG indicators—modeled after the EU’s new SFDR and UN’s SDG targets, respectively—to evaluate nonfinancial ESG performance and TBL impacts of the “most transparent” Transparency Index firms, relative to a control group of similar sized companies. We applied the same analyses to other transparency schemas identified above as well, to contextualize and elaborate upon the generality of any observed linkages between Transparency Index transparency and ESG impact.
Constructing the Transparency Index
A superset of corporations for the Transparency Index included all global companies with common stock or ADRs listed on US exchanges in third quarter 2021. Then a passive exclusionary ESG screen was applied to remove 9 industries considered nontransparent, detracting from index performance and/or having a negative impact on the well-being of people and planet. These industries excluded: Alcohol, Banking, Chemicals, Confectionary, Fossil Fuel Transportation, Gambling, Metals and Mining, Oil and Natural Gas, and Tobacco. The remaining firms were assessed to determine if they had a minimum market cap of $1 billion in 2021, reported revenue, and for IPOs, a minimum of 40 trading days. Firms without corporate websites were removed from the eligible pool of companies for lack of accessible transparency. The resulting set of companies was scored on a scale of 1 to 5, using six transparency KPIs. To be classified a transparent, a company needed to score 60% or higher. Transparency’s six KPIs are described below:
Focusing on 2019 ESG data, one year prior to the disruptive COVID-19 pandemic, numerical analysis compared sustainability profiles of 84 continuing[1] Transparency Index companies to 2,211[2] US-listed globally publicly traded companies2 for which ESG data was available. All had market capitalization greater than $680 million that year.
The primary transparency factor for analysis was binary (i.e., whether a corporation was a member of the Transparency Index group in the third quarter of 2021). Where pertinent, market capitalization and revenue were also examined as secondary factors. ESG response variables were selected to align with two internationally recognized frameworks for reporting on operational risks and opportunities, respectively: The 14 mandatory “adverse sustainability indicators” of the SFDR served as our model for adverse sustainability indicators (ESMA, 2021, pp. 59-63). To capture pursuit of sustainability opportunities, a corporation’s expressed support (or lack thereof) for one or more of the United Nations’ 17 Sustainable Development Goals (SDGs) for 2030 was examined as well.
The relative importance of ESG indicators was not weighted nor were peers individually picked to match the industry mix, market capitalization, or revenue size of the Transparency Index. Instead, the author assessed all of these large, public companies by the same metrics, thereby favoring universally inter-compatible results and avoiding artifacts of subjective numerical manipulation.
Where there were qualitative data—primarily profiles’ responses to true/false questions—that could either supplement the quantitative story or substitute for insufficient quantitative disclosure, those data were analyzed too.
For each comparison, standard nonparametric statistical tests were utilized, supplemented by parametric tests when data or their numerical (log10) transformations were normally distributed within two standard deviations of their mean. Statistical significance of test results is designated as follows: *** = p < .001 (very high), ** = p < .01 (high), * = p < .05 (low).
Finally, the same transformations and analyses were applied to other transparency groups versus their peers to further characterize, compare, and periodically illustrate the generalizability of our findings to other tools for corporate transparency and sustainability tracking. These other transparency groups included “transparent” firms producing highly structured sustainability reports aligned with Global Reporting Initiative Standards (GRIS), semi-structured reports for the UNGC, and/or custom-built CSRS reports. (A given company may have qualified for inclusion in more than one of these groups.) Unlike these ESG sustainability disclosure frameworks, however, the Transparent Index companies were assessed by an external third party, Transparency, thereby emphasizing impartiality. In addition, once profitability and “sin industry” screens were applied, the Transparency Index was a pure play transparency assessment, offering greater confidence in independent relations discovered between transparency factors and TBL results.
RESULTS
Does greater corporate transparency relate to greater ESG performance and TBL sustainability impact? After introducing fundamental financial features of Transparency Index firms versus peers, we compare and contrast these groups’ non-financial sustainability disclosures in the following ESG sequence:
Financial Profiles
| Company (Distinction) | Market Value | Revenue | Value-to-Revenue |
| billion USD | billion USD | ratio | |
| Apple, Inc. (top market value) | $ 1,305 | $ 260 | 5 |
| Amazon.com Inc (top TI) | $ 920 | $ 281 | 3 |
| Walmart, Inc. (top revenue) | $ 337 | $ 524 | 1 |
Amazon was the only mega cap as well as the top earner in the Transparency Index. Beyond this transparent group were 28 additional mega caps, including Apple (largest overall capitalization) and Walmart (top overall earner). Nonetheless, the average market cap ($39 billion) of a Transparency Index firm was more than double that of its peers outside the Transparency Index*** ($18 billion).
Revenue was greatest among mega cap peers—Walmart, China Petroleum & Chemical Corp, PetroChina, and BP PLC—but also highly variable across both groups, altogether averaging about $9.5 billion.
Mean market value-to-revenue ratio was about three for Transparency Index businesses versus two for others, which suggests that Transparency Index companies had intangible value, risk mitigation, innovation, good reputations, or other qualities, such as transparency or ESG excellence that set them apart from their peers.
Environmental Performance and Impact
Financial features above corresponded closely with adverse sustainability indicators for companies’ greenhouse gas emissions (GHGs). Key metrics included CO2e (CO2-equivalent mass of GHGs), carbon footprint (CO2e/market value) and carbon intensity (CO2e/revenue). For instance:
| Company (Distinction) | CO2 Equivalent | Carbon Footprint | Carbon Intensity |
| 1,000 metric tons | tons/million USD | tons/million USD | |
| Apple Inc (top market value) | 915 | 1 | 4 |
| Amazon.com Inc (top Transparency Index) |
11,260 | 12 | 40 |
| Walmart Inc (top revenue) | 18,678 | 55 | 36 |
In general, CO2e and carbon footprint increased, while carbon intensity declined, with both market size and revenue.*** These linkages are explored for Transparent Index companies and less transparent groups below.
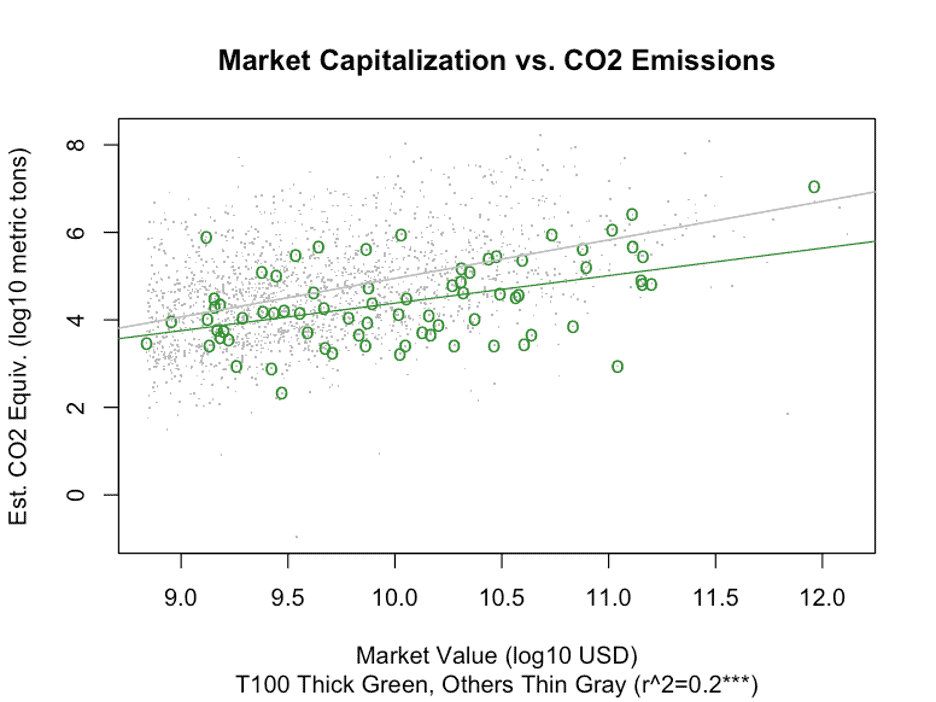
For both groups, CO2e increases steadily and linearly with market size, on a log-log scale (r2 = 0.2***). However, GHGs are substantially lower at Transparency Index (TI) companies (green) when compared to peers of the same market size (gray), rising more gradually with increasing market capitalization.
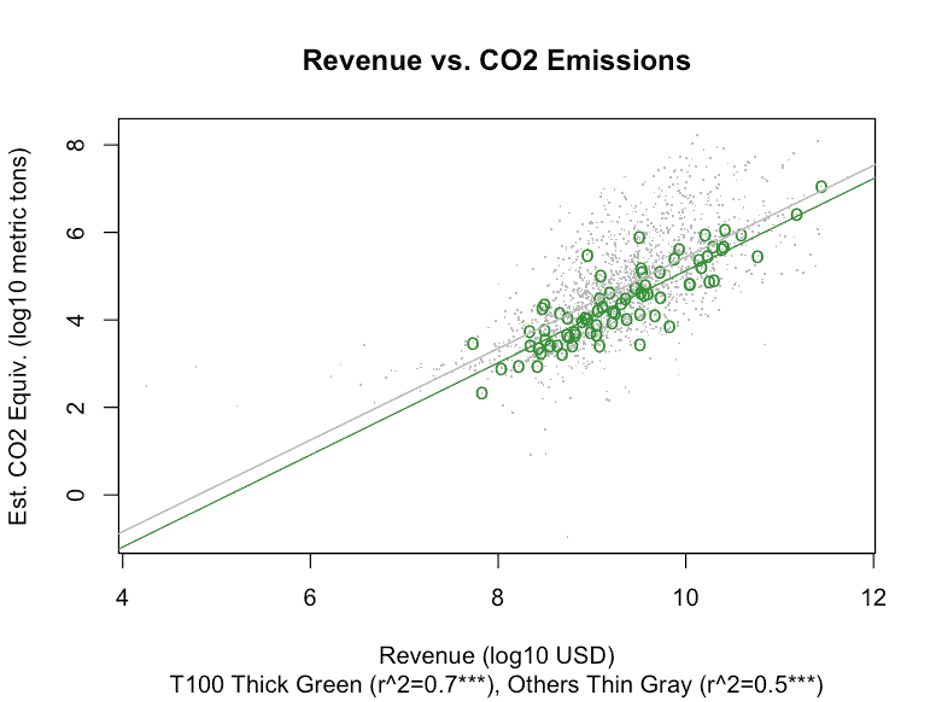
GHGs also increased log-log linearly with firm revenue. Here, Transparency Index companies emitted only about 42% (10-0.38) of the CO2e that their counterparts with equivalent revenue. This contrast extended through to the firms with the very largest revenues in each group.
The Transparency Index’s distinctly lower climate impact extended to typical companies in each group. Despite having twice the market value, the average Transparency Index corporation emitted 80% less CO2e,* with a 90% smaller carbon footprint*** and significantly lower carbon intensity*** than a typical less transparent counterpart. Why?
Similar portions of both groups had policies and programs in place to control emissions (55% of Transparency Index firms and 50% of others). By contrast, half of the Transparency Index used renewable energy, compared to only one third of other companies.*** This usage includes renewable energy procured or produced for internal consumption as well as waste to energy. Is renewable energy a sizable piece of the puzzle?
Recall that Transparency first screened out the entire fossil fuel industry for its nontransparent practices before conducting its transparency analysis on candidate companies. The top 20 GHG emitters from the fossil fuel industry collectively accounted for at least 42% of all CO2e from less transparent companies in 2019. Due to potential double accounting across generators (Scope 1) and users (Scope 2) of fossil fuel-based electricity, this percentage could be even higher. Thus, Transparency Index selection screens and firms’ renewable energy may at least partially account for the observed disparity in climate impact between the Transparency Index and other companies examined here. Still, removal of fossil fuel industries from the less transparent group did not fully resolve the disparity.
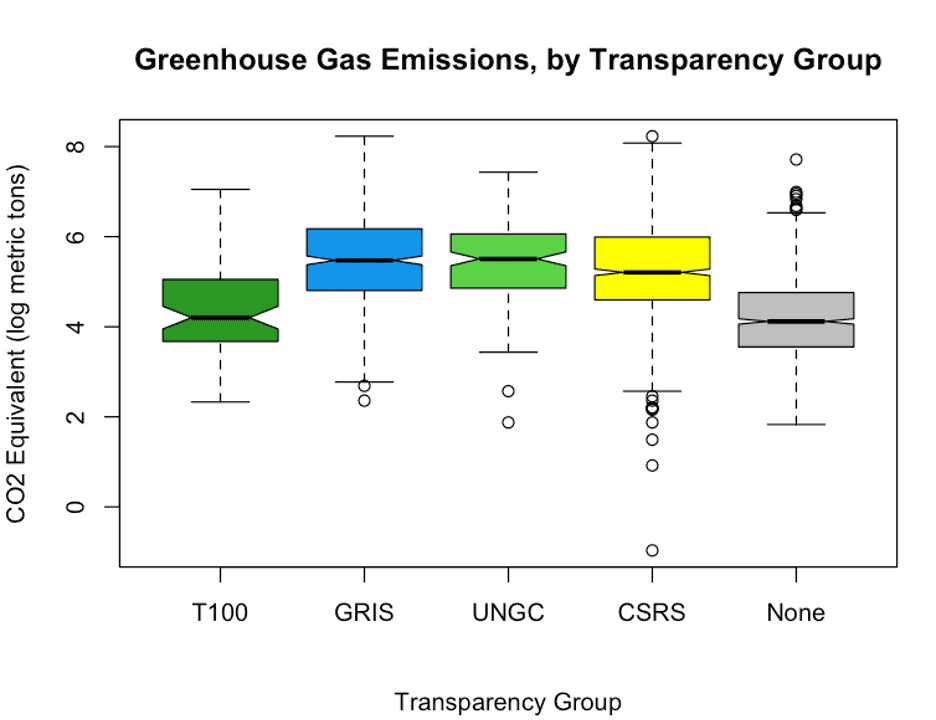
Does the same disparity appear when examining the distribution of Transparency Index firms’ log transformed GHG emissions relative to those using other disclosure systems? Yes, but with a counterintuitive twist. The chart above presents emissions for Transparency Index companies and others pursuing GRIS, UNGC, company-specific CSRS reports, and, as a control, none of the above (“none”). Vertical notches in these boxplots indicate the likely range for that distribution’s true median, estimated as a thick horizontal line near the midpoint of each boxplot.
The Transparency Index and firms that used none of these disclosure tools both had substantially lower median GHG emissions than the companies that used any of the central three systems for their ESG disclosures. In the absence of the control group’s data, the Transparency Index would have appeared exceptional. Instead, this appears to be a more complex enigma that may require additional data or multivariate analysis. Furthermore, this relative distribution persists if one examines carbon footprint or carbon intensity. It is a robust yet so far inexplicable phenomenon. In sum, evidence presented here is consistent with a transparency mindset or culture contributing to more sustainable business practices—such as greater renewable energy use—that limit or reduce greenhouse gas emissions at Transparency Index firms. Still, unless Refinitiv data underestimated GHG emissions from nontransparent corporations, why these firms also had reduced emissions remains unclear.
Limited data coverage constrained effective comparison of quantitative adverse sustainability indicators for other environmental issues of concern. So, alternate metrics were adopted:
With respect to SFDR’s adverse sustainability indicator for waste, access to hazardous waste data at the firm level was insufficient. Instead, analysis assessed waste not recycled (WNR) (i.e., total waste, including hazardous waste, that was not diverted to recycling, composting, or waste-to-energy transfer). WNR increased marginally with company capitalization (r2 = 0.01*) and revenue (r2 = 0.09***) on a log-log scale. For Transparency Index companies, neither of these relationships held, however no statistically significant relationship existed between Transparency Index status and waste not recycled.
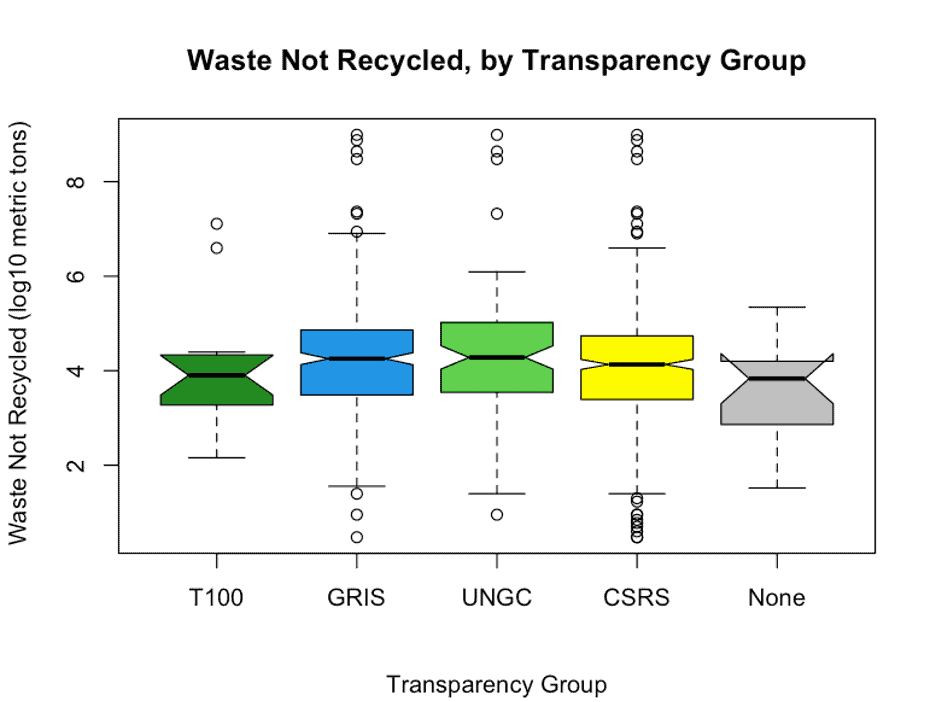
Notched boxplots representing log10-transformed WNR distributions were also examined for Transparency Index, GRIS, UNGC, CSRS, and the “none of the above” control group. Thick horizontal lines inside each box suggest that median WNR was scarcely greater for any transparency group when compared pairwise to the “none” group. Nonetheless, the GRIS group has a significantly greater median WNR relative to “none,” which is unsurprising, given that GRI Standard 306 (2020) requires and explicitly guides corporate documentation of waste-related adverse sustainability indicators. None other among these transparency groups expects such specificity for waste disclosures.
As has been remarked elsewhere, aggregating or procuring accurate, firm-level biodiversity conservation data for companies operating across hundreds or even thousands of locations is difficult. Researchers did not attempt to do so here. Similar logic was applied to limit collection and aggregation of water-pollution-related adverse sustainability indicator data from US EPA, CDP, and many other sources. Thus, GHGs and WNR serve as the key adverse indicators representing environmental impact in this report.
Until this point, examination has focused on adverse sustainability indicators (i.e., corporation-framed indicators of TBL risks). To consider opportunities that could bring shared value and benefits to 1 billion or more people required preliminary beneficial sustainability indicators for corporations looking to pursue pro-environment opportunities as well. The specific indicator utilized here was whether Transparency Index corporations express more support for realizing universally recognized environmental benefits. The 17 United Nations Sustainable Development Goals (SDGs) for 2030 provide arguably the only universal set of benchmarks for doing so. With this in mind, we asked whether Transparency Index companies were more vocal than their counterparts in expressing support for one or more of the environmentally themed SDGs.
At best, about 1 in 8 companies among or beyond the Transparency Index expressed support for any one environmental SDG in 2019: Only 2% of Transparency Index companies supported SDG 6 for clean water and sanitation, significantly lower than the 9% of other companies (Fisher odds ratio: 0.17*). About 8% of each group supported affordable and clean energy, SDG 7. Twelve percent of each group supported responsible consumption and production, SDG 12, and climate action, SDG 13. Finally, 6% or less of either group supported life under water or life on land goals (SDGs 14 and 15). Thus, this data provided no indication that Transparency Index companies are more inclined to state their support for universally recognized United Nations Sustainable Development Goals related to sustaining the environment.
Social Performance and Impact
Social aspects of ESG performance and TBL impact also considered both risk-reducing adverse and opportunity-seeking beneficial sustainability indicators.
With respect to human rights and labor, Transparency Index companies were 17% more likely to have policies associated with proactive human rights practices and fair labor in the workplace (76% vs. 59%; X2(1) = 8.2**). Comparable portions of both groups had policies in place to ensure human rights in general (42%) while some (22%) claim to comply with both the International Labour Organization’s (ILO) Declaration on Fundamental Principles and Rights at Work and the United Nations Universal Declaration of Human Rights. Despite these lofty ambitions, strikingly few businesses expressed support for realizing human rights-focused opportunities aligned with SDGs, including ending poverty (4%) and hunger (4%). More supported ensuring quality education (9%), gender equality (10%), health and wellbeing (11%), and decent work and economic growth (12%). No significant difference existed between Transparency Index and other firms’ limited support for these SDGs as beneficial social sustainability indicators.
The author could not obtain sufficient quality data to compare the Transparency Index firms to other companies regarding the average unadjusted gender pay gap as an SFDR adverse sustainability indicator.
Governance Performance and Impact
Fully 92% of companies in this study had polices on corporate board gender diversity. Despite such gender equity governance policies, actual female participation was much lower, 2 in 9 (22%) overall. By contrast, women participated at 4% higher rates (26%) on Transparency Index boards than other firms’ boards (two sample t-test: t(70) = -2.7**). This step-up is proportional to adding a sixth woman to a 25-person board.
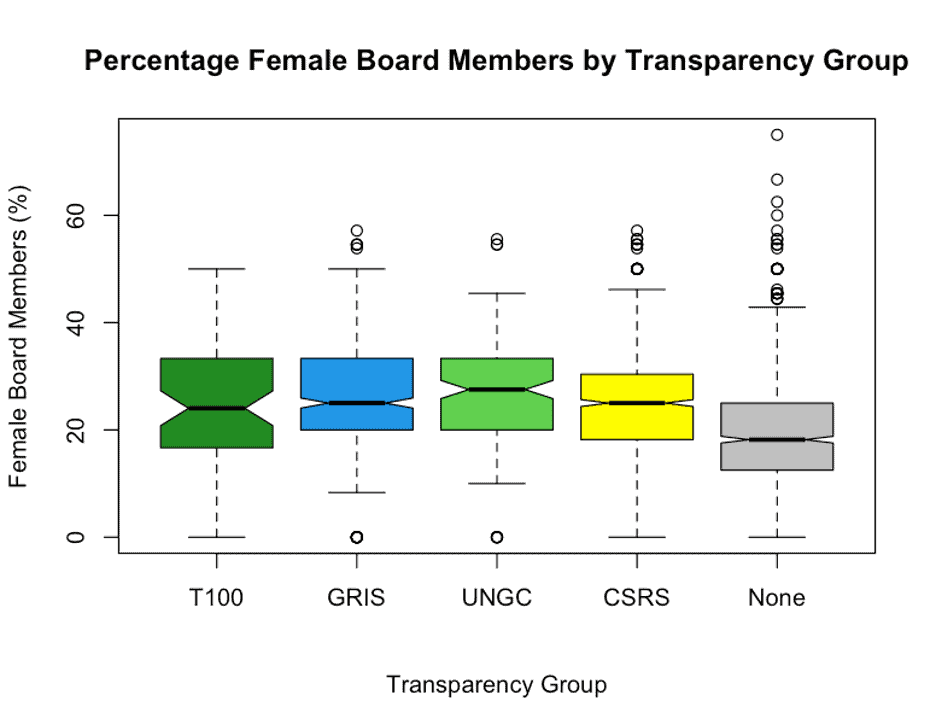
Greater corporate transparency equates with higher proportions of female board members. The thick horizontal lines near the center of each notched boxplot here show how the median percentage of female board members was significantly greater for publicly traded corporations with various well-recognized transparency and disclosure practices. These standouts include firms featured among the Transparency Index, as well as those producing highly structured sustainability reports aligned with GRIS, semi-structured reports for the UNGC, and/or custom-built CSRS reports.
Compared to board gender policies, “communication tools to improve general business ethics” (e.g., whistle blower, ombudsman, suggestion box, hotline, newsletter, website, etc.) were equally pervasive (92%). The Transparency Index firms are no different in this regard, which suggests that both groups would be similarly committed to the 10 ethical business principles of the United Nations Global Compact.
About half of mega caps were UNGC signatories in 2019, while two thirds referenced GRI in the sustainability reports that nearly all produced. Overall, only 7% of 2,295 companies in this study were UNGC signatories, including a statistically insignificant 12% of Transparency Index companies. Given the low participation, SFDR’s two UNGC-related adverse sustainability indicators were not usable for this study.
A much larger proportion of both groups produced CSR sustainability reports, including 45% of nontransparent firms and a statistically greater 59% of Transparency Index firms (X2(1) = 4.5*). Along with more women on corporate boards, this greater CSR disclosure provided qualified support for the notion that a Transparency Index corporation’s transparency mindset or transparency culture could help it to unearth and avoid some governance risks associated with adverse sustainability indicators.
Overall, one in four Transparency Index firms and one in five others used GRI in their ESG reporting. Beyond the mega caps, both UNGC and ESG transparency tools were underutilized. This finding suggests an uphill climb for pervasive, voluntary ESG reporting but with great potential upside.
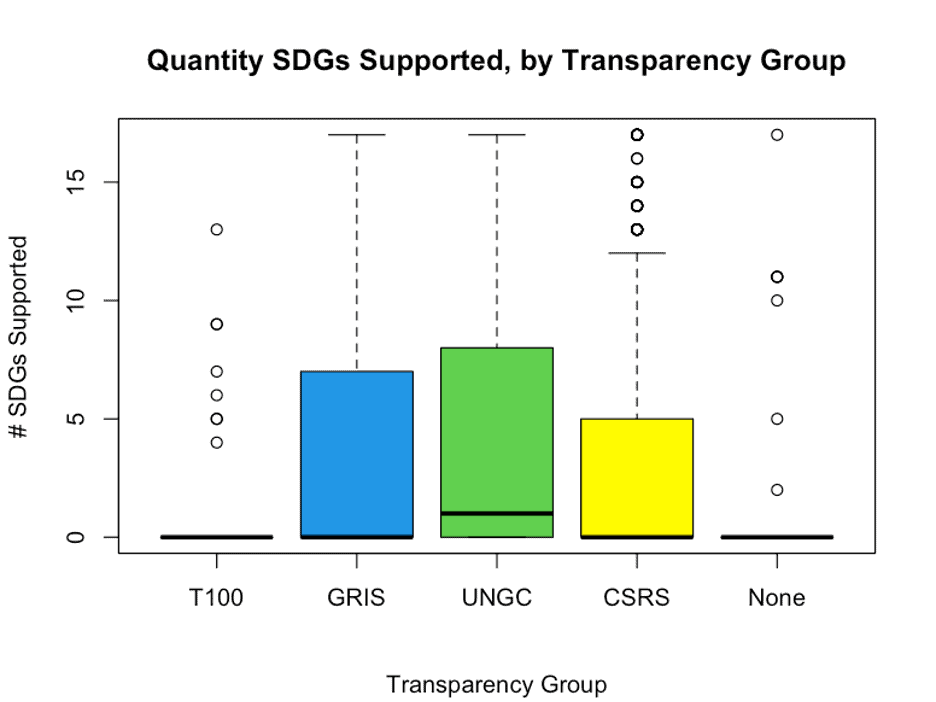
Beneficial sustainability indicators related to the UN SDGs did not provide any further validation that Transparency Index-style transparency relates to better ESG outcomes. No more than 13% of either subset of companies supported any one SDG. Furthermore, Transparency Index companies of 2019 were no more likely than their contemporary peers to support any specific UN sustainable development goal. For two goals—SDG 6 for water and sanitation and SDG 16 for peace, justice, and strong institutions—at least 5% fewer Transparency Index companies supported the goal than did their peers. Furthermore, only Transparency Index companies expressed zero support for any SDGs, notably SDG 16 and SDG 13.
|
Breadth of SDG Support |
In-Group Mean |
Out-Group Mean |
Difference |
|
UN Global Compact Signatory |
4.5 |
0.9 |
+ 3.1*** |
|
CSR Sustainability Reporter |
2.5 |
0.1 |
+ 2.4*** |
|
Transparency Index |
0.9 |
1.2 |
– 0.3 |
Finally, how did transparency groups relate to our beneficial sustainability indicators as a whole? We respond by assessing breadth of companies’ expressed support across the 17 United Nations Sustainable Development Goals: Half of companies who were UNGC signatories conveyed support for at least one SDG. The average signatory communicated support for 4.5 SDGs, compared to only one SDG for their peers. CSR sustainability reporters support on average 2.5 sustainable development goals, compared to 0.1 among their peers. Meanwhile, Transparency Index companies supported on average 0.9 SDGs, lower but not statistically distinct from their peers at 1.2 SDGs each. In contrast to these other groups, Transparency Index companies voiced support for at most 13 SDGs (as McCormick & Company exemplifies). Conversely, 75% of firms in both the Transparency Index and “none” groups did not show support for any SDG in 2019.
DISCUSSION
Does inclusion in the Transparency Index correspond to greater ESG performance and sustainability impact? For a certain subset of sustainability indicators, yes, significantly. These indicators include:
The most transparent firms realize financial dividends and TBL co-benefits from their open corporate cultures. However, apparent underreporting and sparsely populated ESG data tables suggest that it may be a long while before one can access complete enough information to get a full accounting of the co-benefits and opportunities resulting from exceptional transparency.
Among potentially missed opportunities are those that permit transparent leaders to monetize their transparency culture through training and partnerships with others who seek to adopt more transparent business practices. In addition, there is boundless upside to focusing the open cultures of transparency leaders upon some of the greatest needs of our era, such as addressing pandemics and the UN Global Goals for 2030. Open societies also have much to gain from sending forth these emissaries of transparency to encourage greater global embracing of its gifts. In short, to ensure every human being can thrive on Earth may require a transformation of transparency itself, from a contrarian corporate culture to a key characteristic of our civilization.
REFERENCES
Center for Audit Quality. (2021, August 9). S&P 500 and ESG Reporting. https://www.thecaq.org/sp-500-and-esg-reporting
Cort, T., & Esty, D. (2020). ESG standards: Looming challenges and pathways forward. Organization & Environment, 33(4), 491–510. https://doi.org/10.1177/1086026620945342
Deckelbaum, A. J., Karp, B. S., Turano, L. C., Wiersma, L. L., Curran, D., & Duran, L. A. (2022, January 26). Sustainability & ESG: 2021 Year in Review – Key Takeaways. https://www.paulweiss.com/practices/sustainability-esg/publications/sustainability-esg-2021-year-in-review-key-takeaways?id=42230
Elkington, J. (1997). The triple bottom line. Environmental Management: Readings and Cases, 2, 49-66.
European Securities and Markets Authority. (2021). Final Report on draft Regulatory Technical Standards (JC 2021 03) https://www.esma.europa.eu/sites/default/files/library/jc_2021_03_joint_esas_final_report_on_rts_under_sfdr.pdf
Fink, L. (2022). Letter to CEOs: The power of capitalism. https://www.blackrock.com/corporate/investor-relations/larry-fink-ceo-letter
Global Reporting Initiative. (2020). Global Reporting Initiative: 306 Waste. https://www.globalreporting.org/standards/media/2573/gri-306-waste-2020.pdf
Tamimi, N., & Sebastianelli, R. (2017). Transparency among S&P 500 companies: An analysis of ESG disclosure scores. Management Decision, 55(8), 1660–1680. https://doi.org/10.1108/md-01-2017-0018
Rainey, D. L. (2010). Sustainable business development: Inventing the future through strategy, innovation, and leadership. Cambridge UP.
Standish, J. (2021, Oct. 18). What’s a surefire way to hit ESG targets? Start with transparency. Forbes. https://www.forbes.com/sites/jillstandish/2021/10/18/whats-a-surefire-way-to-hit-esg-targets-start-with-transparency/?sh=284878bd400e
United Nations General Assembly. (2015, Oct. 15). Transforming our world: The 2030 Agenda for Sustainable Development A/RES/70/1. https://www.un.org/en/development/desa/population/migration/generalassembly/docs/globalcompact/A_RES_70_1_E.pdf
World Commission on Environment and Development (1987). Our Common Future. UN Department of Economic and Social Affairs: Sustainable Development. https://sustainabledevelopment.un.org/content/documents/5987our-common-future.pdf
World Economic Forum. (2020, September 20). Measuring Stakeholder Capitalism: Towards Common Metrics and Consistent Reporting of Sustainable Value Creation. https://www.weforum.org/reports/measuring-stakeholder-capitalism-towards-common-metrics-and-consistent-reporting-of-sustainable-value-creation
Yu, E. P., Guo, C. Q., & Luu, B. V. (2018). Environmental, social and governance transparency and firm value. Business Strategy and the Environment, 27(7), 987–1004. https://doi.org/10.1002/bse.2047
Author’s Note: The validity of findings and conclusions in this paper is contingent upon the accuracy and completeness of data provided by Refinitiv.