Build Corporate Trust
Certify Your Company As One of the World's Most Transparent Brands
Dr. Derek Horstmeyer
School of Business, George Mason University
I appreciate the helpful comments from Dr. Rainford Knight, Ano Glonti, Paul Pagnato and the faculty at George Mason University. Contact the author at School of Business, George Mason University, 4400 University Drive, Fairfax, VA 22030; fax: 703-993-1867, tel: 650-862-9582, email: dhorstme@gmu.edu.
In this paper, we address how firm transparency relates to equity returns. Considering various measures of transparency along cost disclosure, accountability, benchmarks, truth, terms of service, and trust dimensions, we find that firm transparency is positively associated with firm risk-adjusted returns. The primary channels by which these abnormal returns manifest is through the accountability, benchmarks and cost channels. We then explore how these transparency measures relate to firm financial measures like operating revenue growth, and other variables known to be associated with long-term returns.
The question of whether firm transparency is positively associated with excess performance or negatively associated with excess performance is still an open question. On one hand, practitioners often argue that a firm needs to protect its secrets from its competitors and therefore needs to maintain a level of information asymmetry between them and their customers/clients in order to deliver superior performance to shareholders.
Yet, firm transparency may also be value adding in its ability to attract capital and support investor interest via the reduction in asymmetric information. Investors and clients may feel more confident in dealing with a company that is transparent in its protocols, accounting, benchmarks and costs since this level of transparency could signal a lower probability of financial distress.1
We decided to tackle this exact question – how does firm-level transparency relate to asset returns and by which channels do these returns manifest? Using proprietary data provided by Transparency Invest™, we examine firm transparency along six distinct dimensions (accountability, benchmarks, trust, truth, terms and cost) and find that transparency is associated with abnormal returns and performance. The estimates of abnormal returns average 50 basis points per month, which yields an abnormal return of over 6 percentage points per annum. These results hold after controlling for other factors known to influence firm returns (namely the Fama-French 5 factor model). In addition, we find that the primary channel that these excess returns manifest are through the accountability, benchmarks and cost transparency variables.
Certify Your Company As One of the World's Most Transparent Brands
We then explore how these factors relate to other firm-level statistics that are associated with long-run firm success. In particular we find that transparent firms are associated with stronger revenue growth and this primarily plays out through the cost and trust channels.
This work adds to an existing literature on transparency and firm returns in that it is the first to use direct measures of firm transparency to address the issue of excess returns. Past work looking at firm transparency has focused on market micro-structure measures of transparency (Easley and O’Hara (2004), Gu et al. (2021)) or have limited their scope to public accounting measures like intangible assets or volatility of performance to capture information asymmetry at the firm level (Armstrong et al. (2014)).2 While these past measures do capture some aspect of firm transparency, the work detailed here is the first to look at firm transparency directly – examining the direct relationship between the firm and the investor and capturing the degree to which the investor knows about the costs they are paying, the standards of the firm, the terms they are agreeing to, and the degree to which the company is trustworthy.
This paper proceeds as follows: Section II presents the data construction and summary statistics. Section III presents the empirical methodology and results. Section IV concludes the paper.
In the proceeding section, we summarize the data construction, detail all variables that are used in the study and provide summary statistics including correlation among variables of interest.
First, the six primary transparency variables come from Transparency Invest™ . To develop their transparency measures, the firm starts with the entire universe of publicly traded primary securities in the world. The starting number of securities are 58,708 securities that are across all the exchanges including: Latin America, Europe, and Asia’s exchanges.
Next, initial screens are implemented to construct the initial pool of potential firms: first, global companies with listed common stock and ADRs traded on US exchanges are considered for analysis. In addition, the ESG exclusionary method is applied to remove 9 industries due to negative impact on in- vestment performance and the well-being of people. These industries are: Alcohol, Banking, Chemicals, Confectionary, Fossil Fuel Transportation, Gambling, Metals & Mining, Oil & Natural Gas and Tobacco. Next, each firm must have a minimum market cap of 1 billion and have recorded revenue. Finally, companies without corporate websites are excluded from consideration. This initial screening makes up the potential dataset from which the Transparency portfolios and non-Transparency portfolios are formed.
Following the establishment of these companies that make the cut, six transparency measures are captured for each firm in time-series:
For each of the six individual Transparency measures, a score of 1 to 5 is given to a given firm. Adding these up over the six factors, a firm will be allocated to the ‘Transparent portfolio’ if their six factors add up to over 60% (18 out of 30 for firms that have available scores for all six factors). This delineation captures the top quintile of firms. All other firms that score below 60% will be allocated to the ‘non-Transparent portfolio’.
In addition, from Compustat and Morningstar Direct we access the following firm-specific information necessary for the analysis: current assets ($MM), intangible assets ($MM), total assets ($MM), return on assets, price to earnings ratio, price to sales ratio, operating revenue growth (year over year), revenue growth (year over year), financial leverage, and market capitalization ($MM). All return data for portfolios and individual firms is pulled from CRSP. All control variables needed for the Fama-French five factor models is accessed from the Ken French’s website. All variables constructed are windsorized throughout at the 1% level.
First, it is important to detail how firm transparency measures relate to firm characteristics. Table I reports summary statistics for the sample of 2355 portfolio-year observations from 2016 to 2020. The firm financial descriptive statistics for the Transparency portfolio in Panel A include: current assets ($MM), intangible assets ($MM), total assets ($MM), return on assets, price to earnings ratio, price to sales ratio, operating revenue growth (year over year), revenue growth (year over year), financial leverage, and market capitalization ($MM). Panel B presents summary statistics for difference in means between the Transparency portfolio (Column (1)) and the non-Transparency portfolio (Column (2)). Panel C presents summary statistics for difference in medians between the Transparency portfolio (Column (1)) and the non-Transparency portfolio (Column (2)).3
The first salient feature of the data is that the average firm in the Transparency portfolio is larger in terms of market cap and total assets and has a great valuation (P/E ratio) as compared to the average firm in the non-Transparency portfolio (all differences of medians significant at the 5% level). In addition, it is interesting to note that there is not significant differences in revenue growth measures between the two samples.
Table II reports results for correlations between individual transparency measures over the sample period. Panel A presents correlation statistics for all of the six measures: Benchmarks, Terms, Accountability, Cost, Truth and Trust. Panel B presents the correlation between various transparency measures and financial statistics in the sample (current assets ($MM), intangible assets ($MM), total assets ($MM), return on assets, price to earnings ratio, price to sales ratio, operating revenue growth (year over year), revenue growth (year over year), financial leverage, and market capitalization ($MM).
Panel A of Table II highlights that Accountability is slightly negatively correlated with both Benchmarks and Terms. Next, Cost is negatively correlated with Truth and Trust (all significant differences at the 5% level).
Panel B of Table II demonstrates that Accountable firms and those that score well for the Cost variable are larger in terms of total assets and market cap. Firms that score higher on Truth and Trust are also larger firms but only in terms of market cap. Next, firms that score well on Cost and Trust are associated with greater revenue growth (significant at the 5% level).
In the following section, we detail the relationship between Transparency and asset returns. First, we detail how Transparency measures relate to returns on an unadjusted basis. Then we detail the relationship adjusting for factors we know affect long-run returns. Finally, we examine individual components of the Transparency measure to assess which factors are driving the returns.
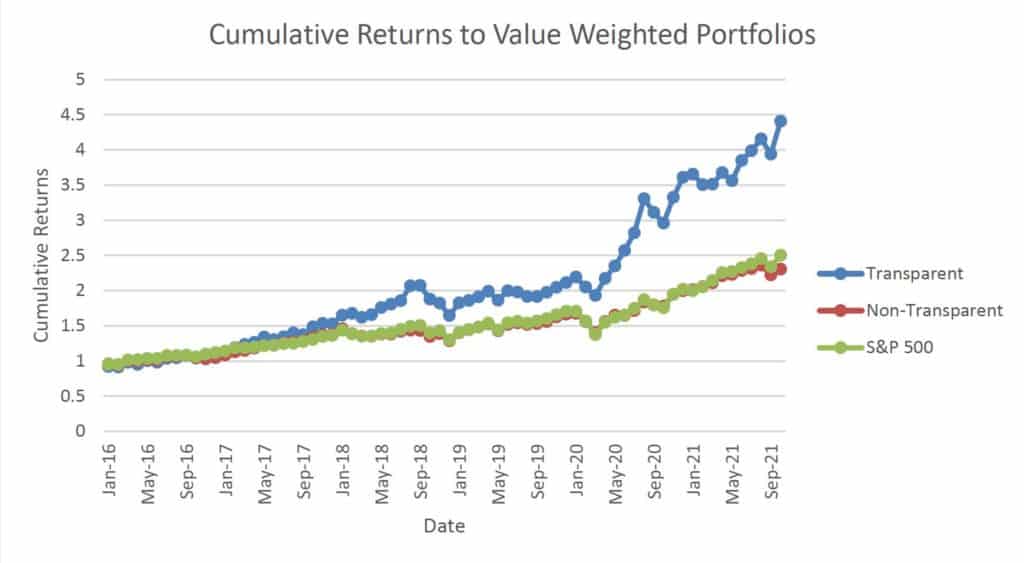
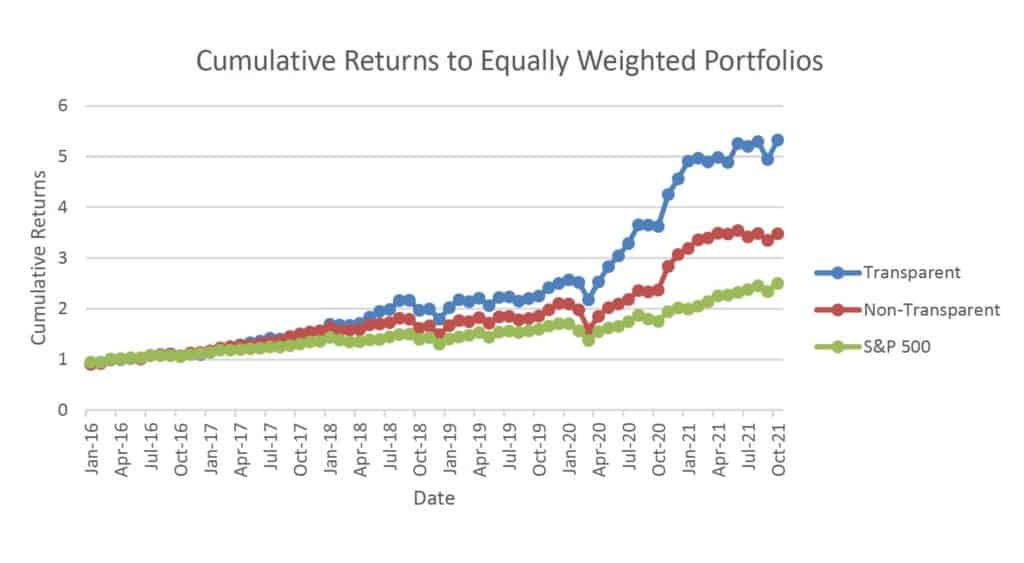
Chart I highlights the cumulative returns to the Transparency portfolio, the non-Transparency portfolio and the S&P 500 between 2016 and 2021. The initial position of each portfolio is indexed to a dollar. On a value-weighted basis, the Transparent portfolio has a final balance of 4.40 while the non-Transparent portfolio has a final balance of 2.50. On an equally-weighted basis, the Transparent portfolio has a final balance of 5.33 while the non-Transparent portfolio has a final balance of 3.48.
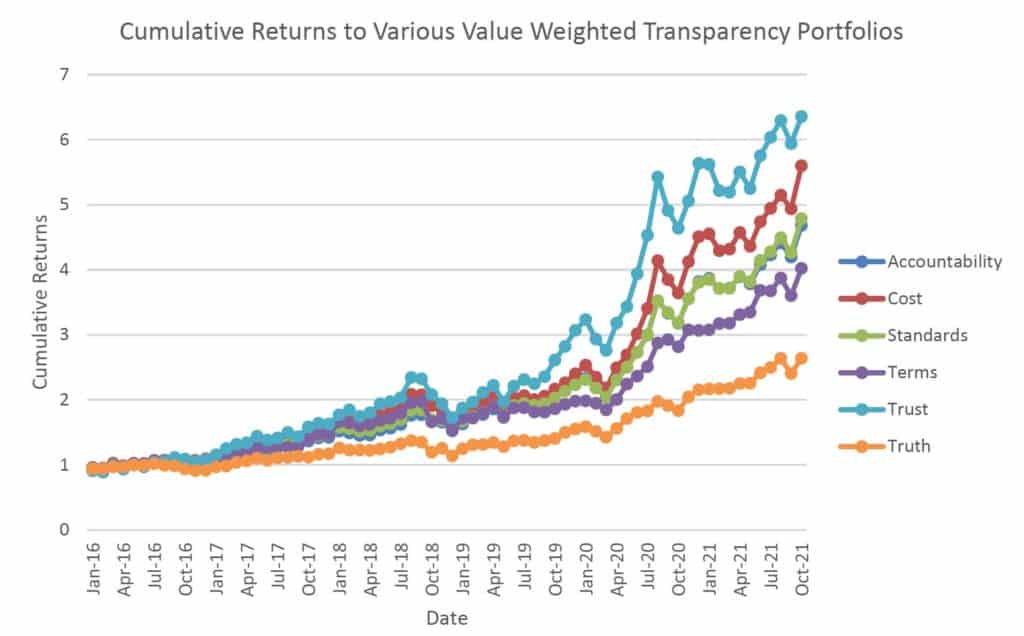
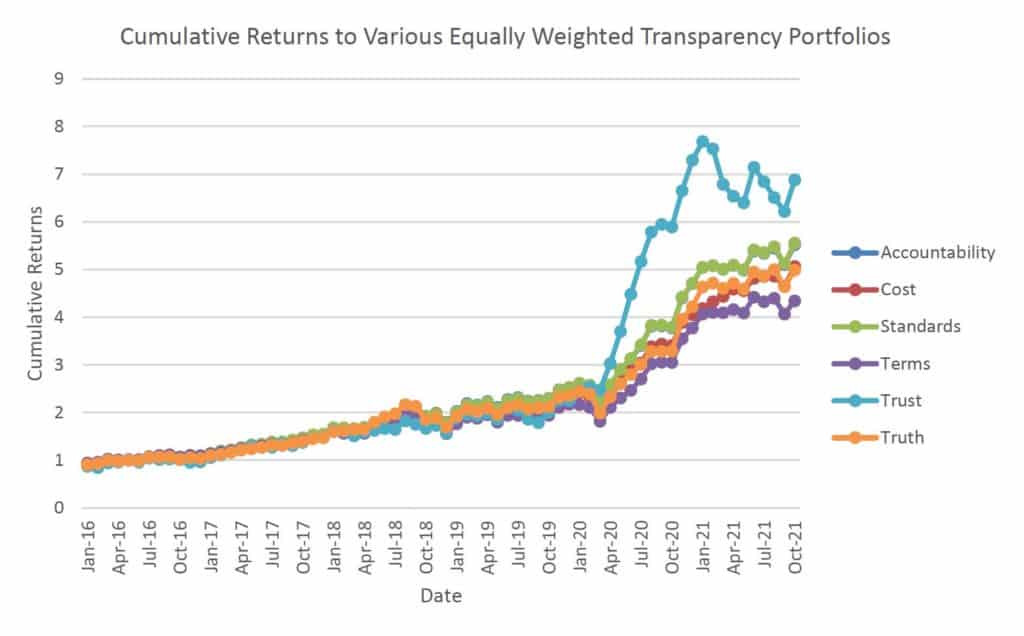
Next, Chart I also denotes the cumulative returns to the six Transparency factors isolated by themselves. Over the 2016 to 2021 time period, the Trust factor does best in terms of returns on a value-weighted portfolio basis while the Truth factor does worst. On an equally-weighted portfolio basis, the Trust factor again does best while the Terms factor does worst.
Table III addresses the issue of excess returns but adjusting for factors that are known to affect returns. To adjust for these factors we run the Fama-French 5 (FF 5) factor model:
Rett = α + βMktRMkt−Rf + βSMBRSMB + βHMLRHML + βRMW RRMW + βCMARCMA
The FF 5 factor regression is run on each Transparency portfolio over the time period (monthly returns). Mkt-Rf, the excess return on the market, value-weight return of all CRSP firms incorporated in the US and listed on the NYSE, AMEX, or NASDAQ. SMB (Small Minus Big) is the average return on the nine small stock portfolios minus the average return on the nine big stock portfolios. HML (High Minus Low) is the average return on the two value portfolios minus the average return on the two growth portfolios. RMW (Robust Minus Weak) is the average return on the two robust operating profitability portfolios minus the average return on the two weak operating profitability portfolios. CMA (Conservative Minus Aggressive) is the average return on the two conservative investment portfolios minus the average return on the two aggressive investment portfolios.
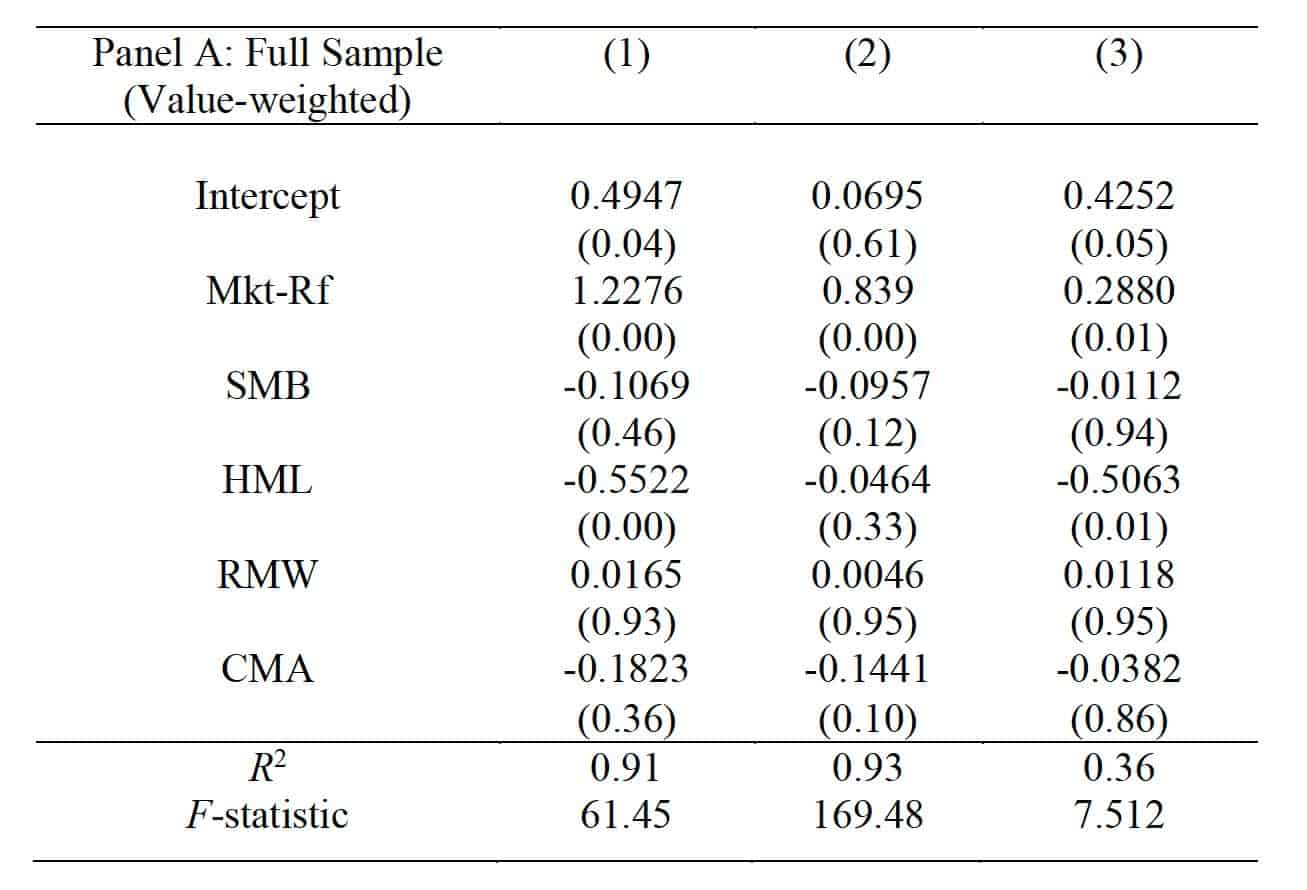
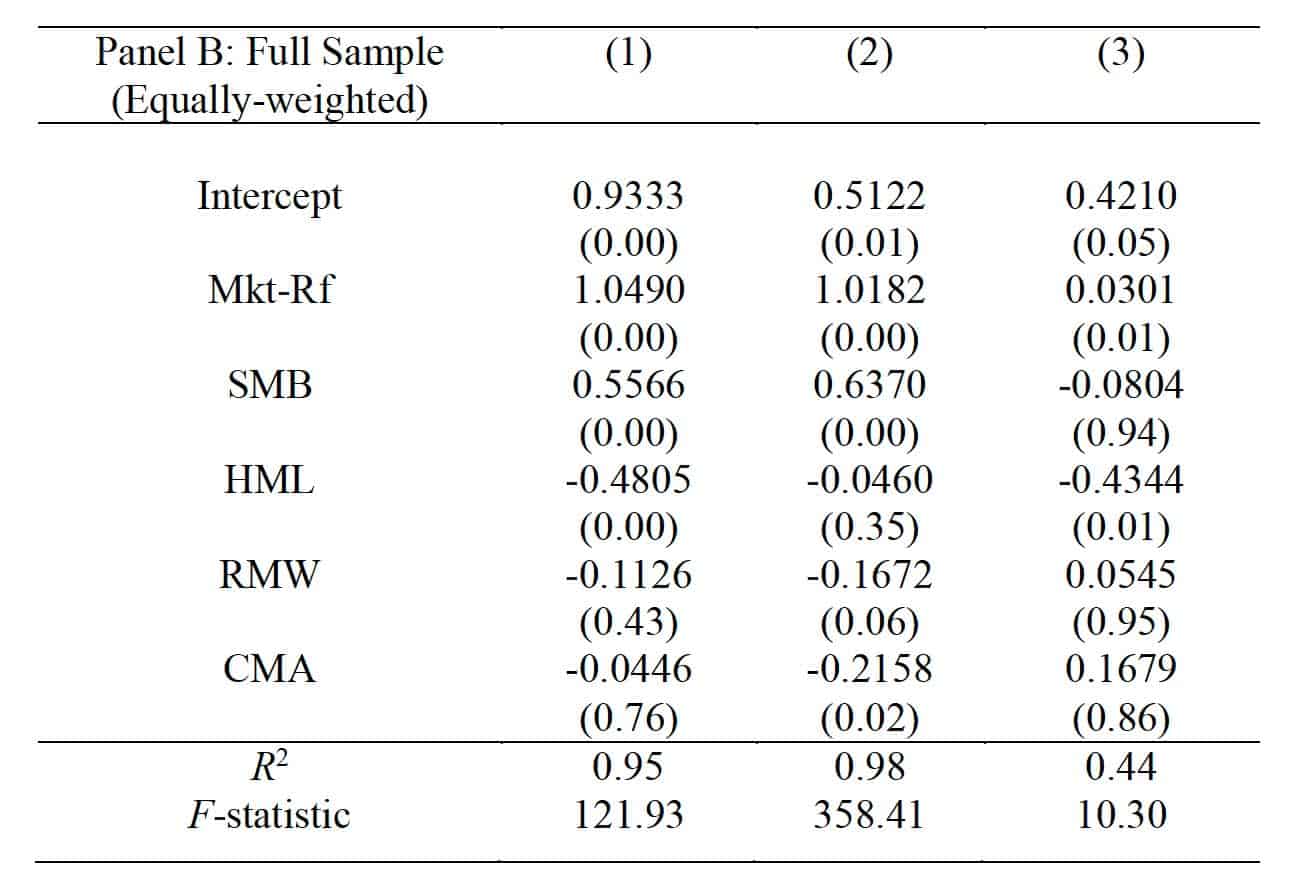
Table III Panel A presents the results for a series of Fama-French 5-Factor time series regressions where all portfolios are value-weighted. Panel B presents the full results where all portfolios are equally- weighted. Column (1) presents the results for the Transparent portfolio. Column (2) presents the results for the non-Transparent portfolio. Column (3) presents the results for the neutral portfolio (Transparent minus non-Transparent. Standard errors are computed using robust methods and p-values are reported below coefficients in parentheses.
The first interesting finding is that in Panel A Column (1) the excess return coefficient is 0.4947 and is significant at the 5% level. This indicates an excess return of nearly 50 basis points per month once adjusting for all pricing factors. In Panel B Column (2) we can see no significant coefficient on the same excess return statistic for the non-Transparent regression. Next it is important to note the coefficients on the market return factor and the HML factor. In Column (1) the market return coefficient is 1.2276 and is significant at the 1% level and the coefficient on the HML factor is -0.5522 which is again significant at the 1% level. This indicates that our Transparent portfolio has significant market risk and is titled toward growth companies (low book-to-market companies).
In Column (3) of Panel A we run a ‘neutral’ regression where the returns to the non-Transparent portfolio are subtracted from Transparent portfolio each month. Again we see similar results here in terms of excess returns. The intercept in this regression is 0.4252 (significant at the 5% level) which indicates a 42 basis per month excess return on a market neutral portfolio. Panel B presents results where an equally weighted portfolio is used and again qualitatively similar results hold throughout.
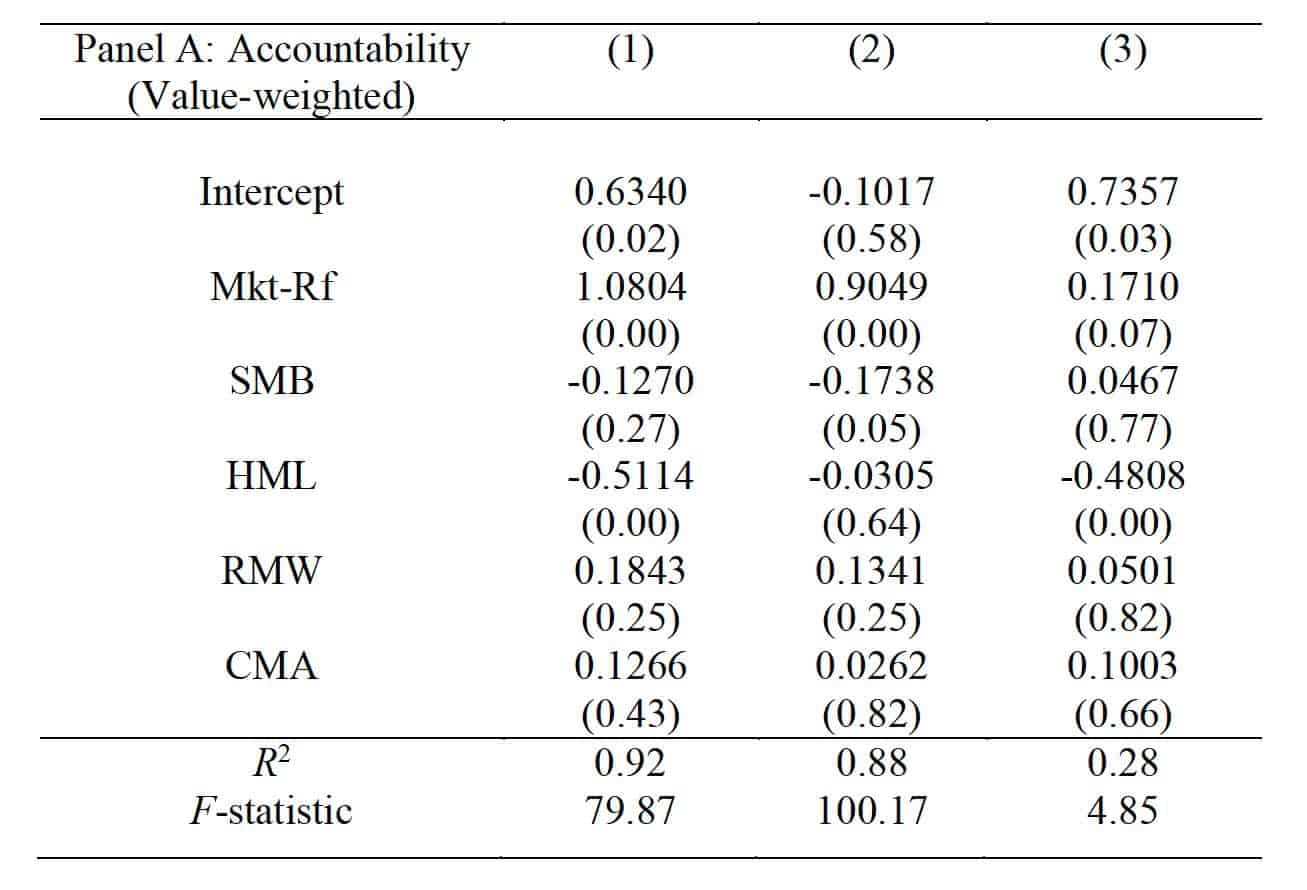
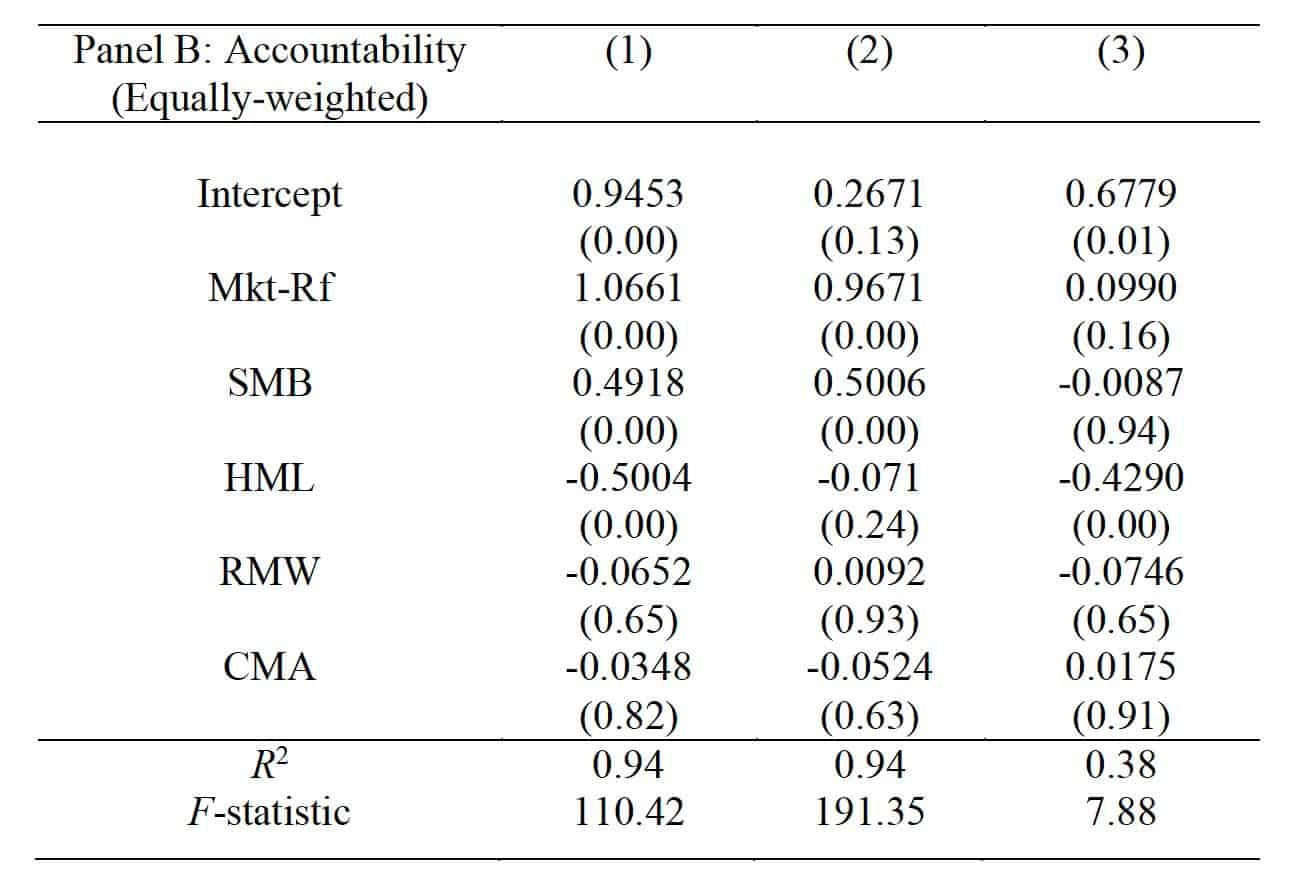
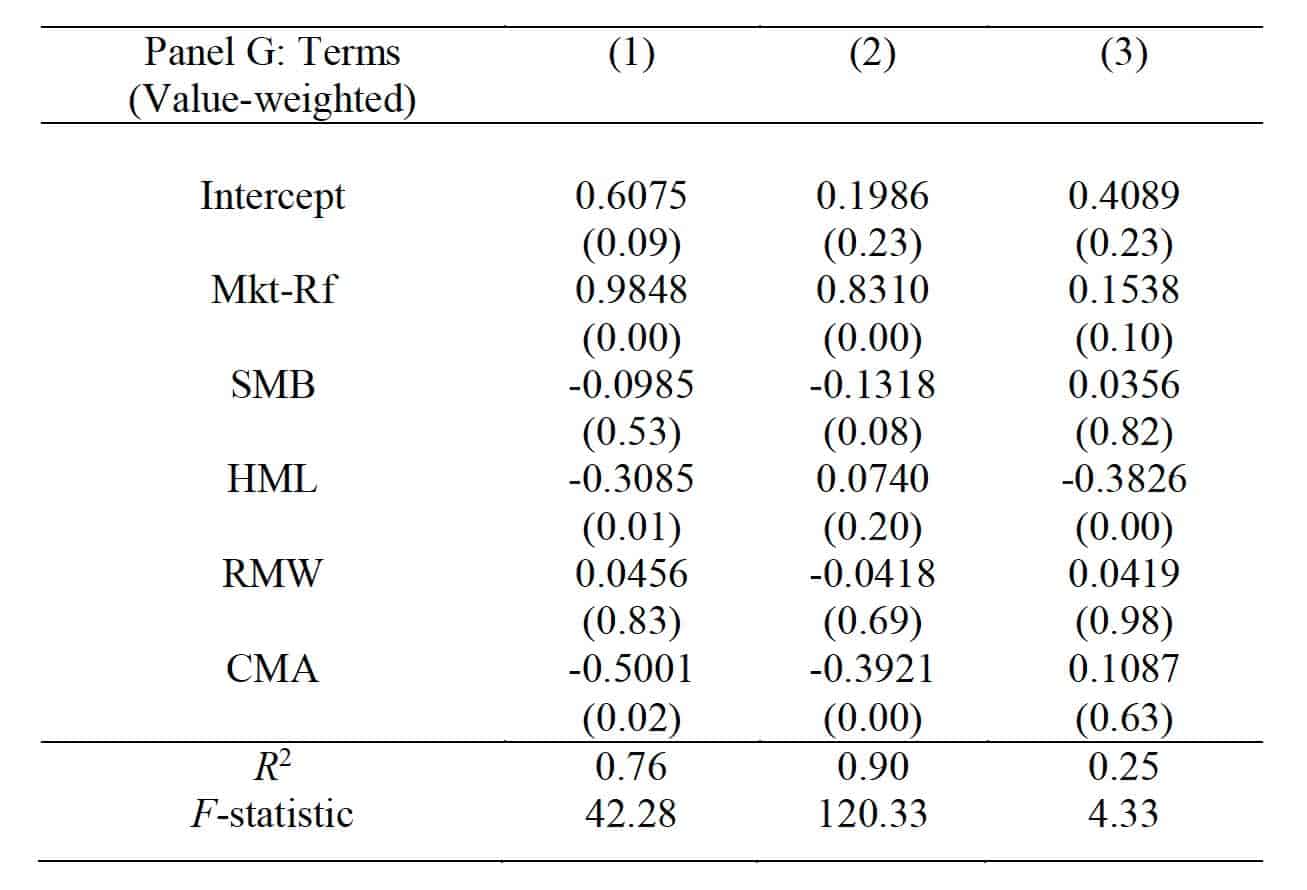
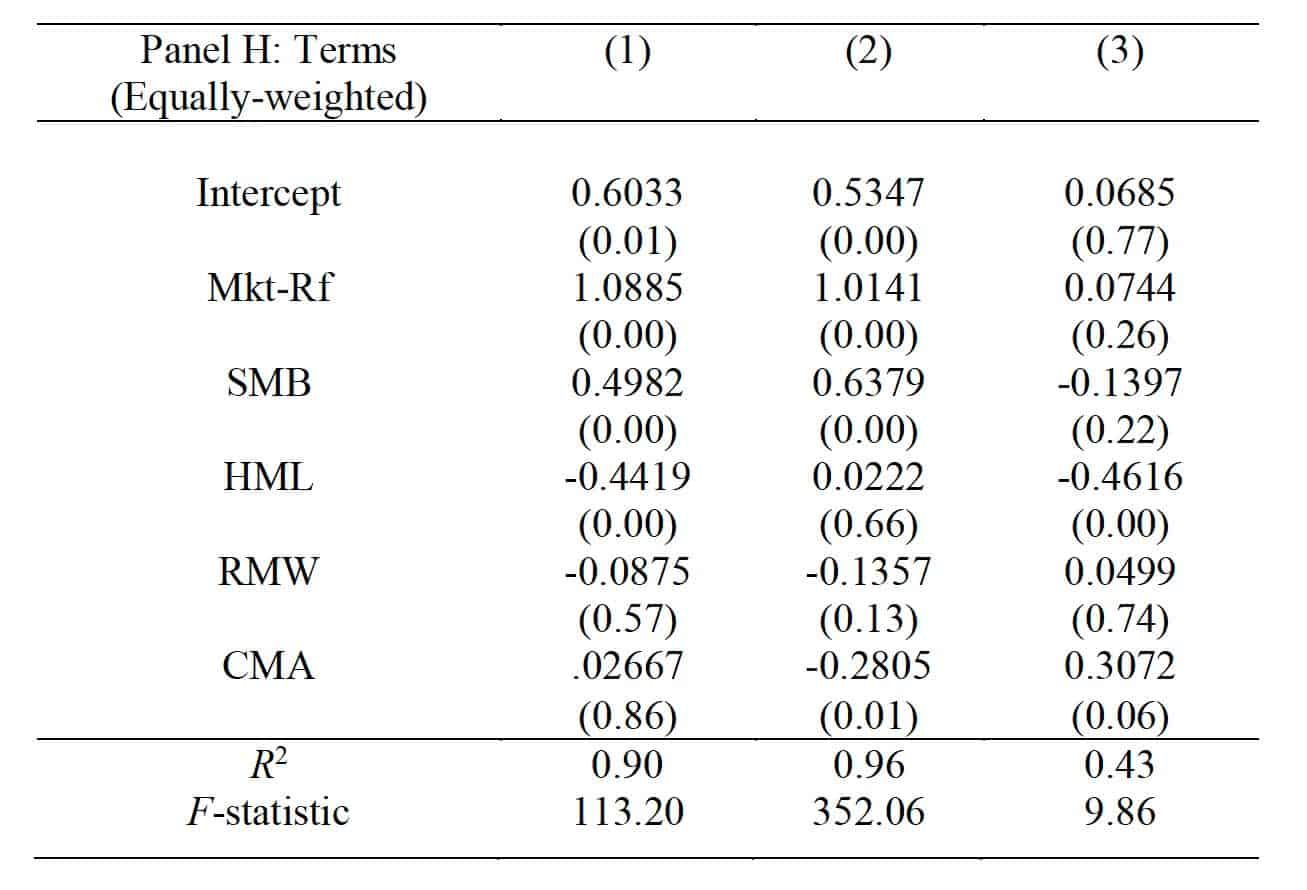
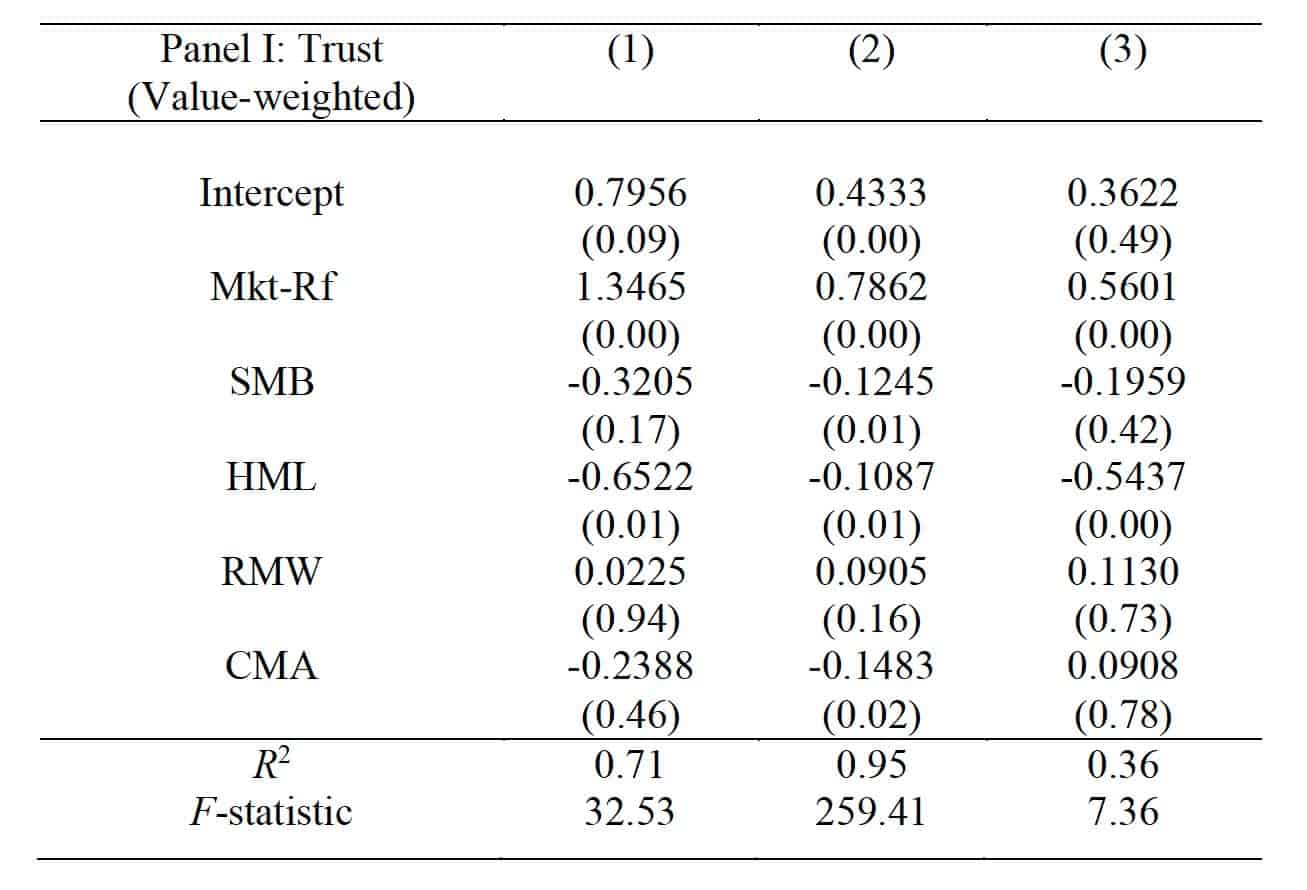
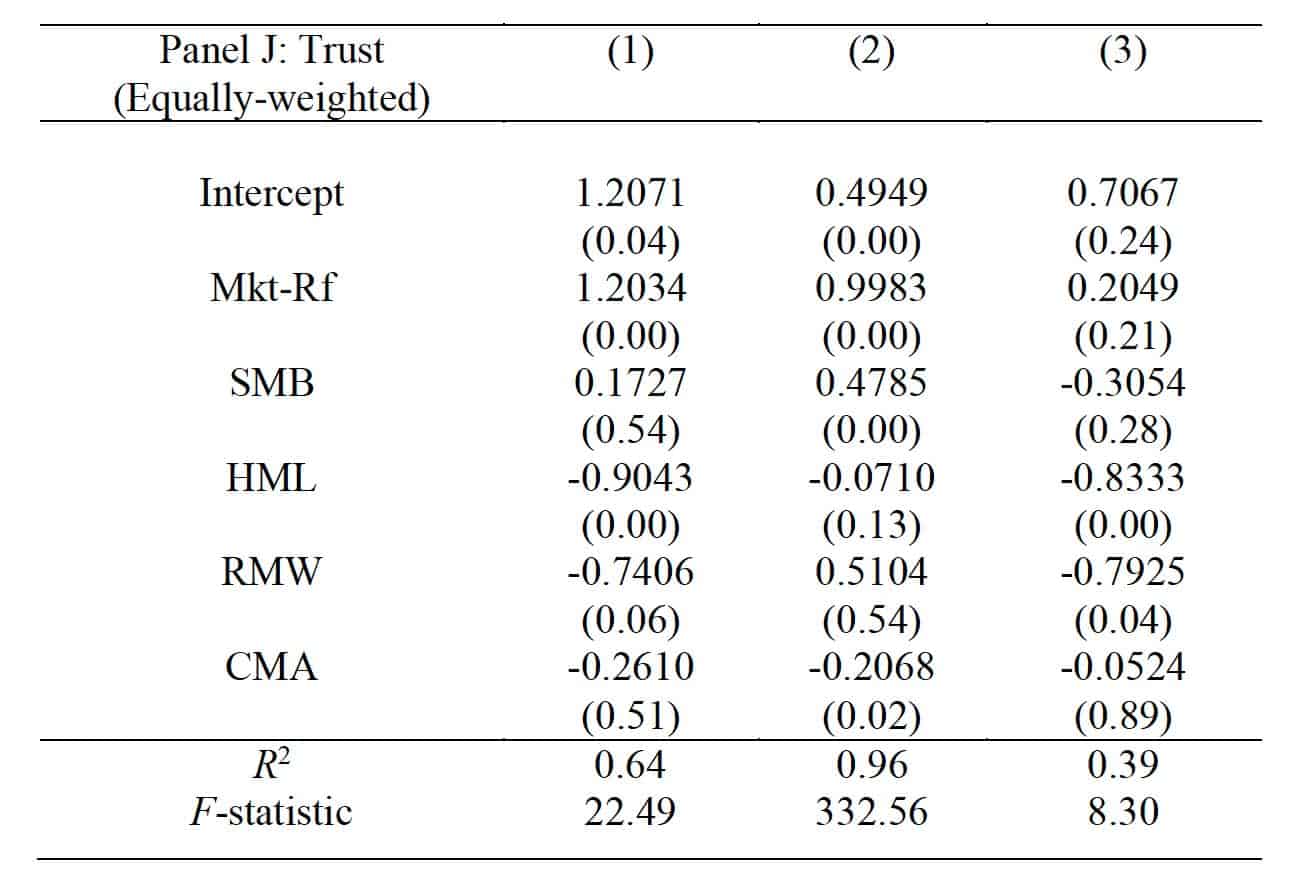
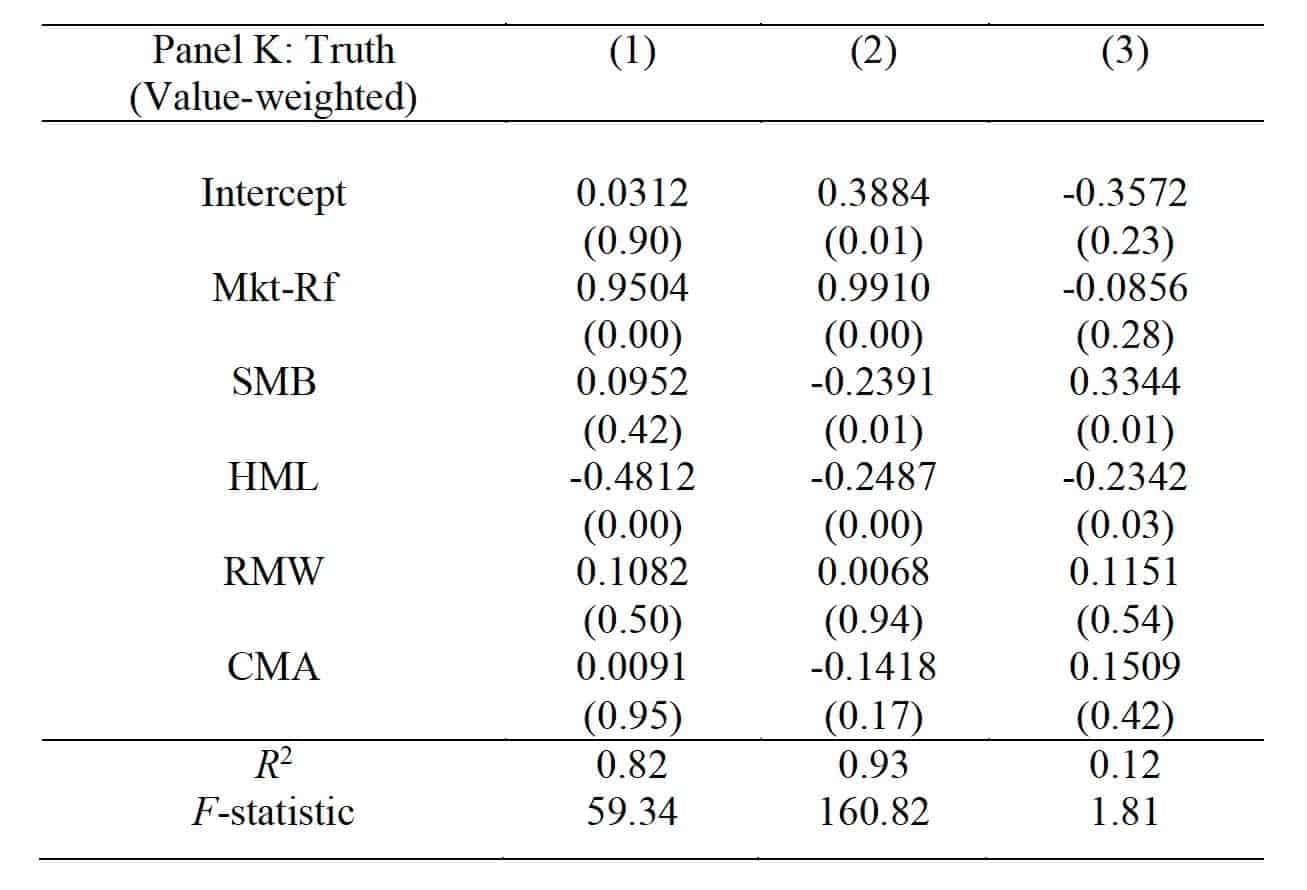
In Table IV we explore the returns to individual Transparency factors. Panel A-B presents the results for the Accountability portfolio, Panel C-D presents the results for the Cost portfolio, Panel E-F presents the results for the Benchmarks portfolio, Panel G-H presents the results for the Terms portfolio, Panel I-J presents the results for the Trust portfolio, and Panel K-L presents the results for the Truth portfolio. All individual portfolios are formed by taking firms that score a 4 or 5 on a particular factor as being included in the portfolio. All firms that score a 1 or 2 on a particular factor are allocated to the ‘Non’ portfolio. So for instance if a firm scores a 4 on Accountability, it will be allocated to the Accountability portfolio. If a firms scores a 2 on Accountability, it will be allocated to the ‘non-Accountability’ portfolio.
Panel A of Table IV highlights the results for the Accountability measure. Column (1) presents the results for the Accountability portfolio. Column (2) presents the results for the non-Accountability portfolio. Column (3) presents the results for the neutral portfolio (Accountability minus non-Accountability).
Similarly to the results in Table III, in Column (1) and Column (3) we can see a positive and significant intercept term. This indicates that on an unadjusted basis and on a market neutral basis, the Accountability portfolio is generating an average of 68 basis points in excess returns per month (FF 5 factor adjusted – average of Column (1) and Column (3)). This excess return result holds in Panel B where the results are presented on an equally weighted basis.
Examining the other individual Transparency measures we see similar positive and significant intercept terms for Cost (Panel C and D), and for Benchmarks (Panel E and F). But the positive and significant intercept terms fail to manifest for the other panels presented for Terms, Trust and Truth. These results highlight the primary channel by which the excess returns noted in Table III are being transmitted through the Cost, Accountability and Benchmarks measures of Transparency.
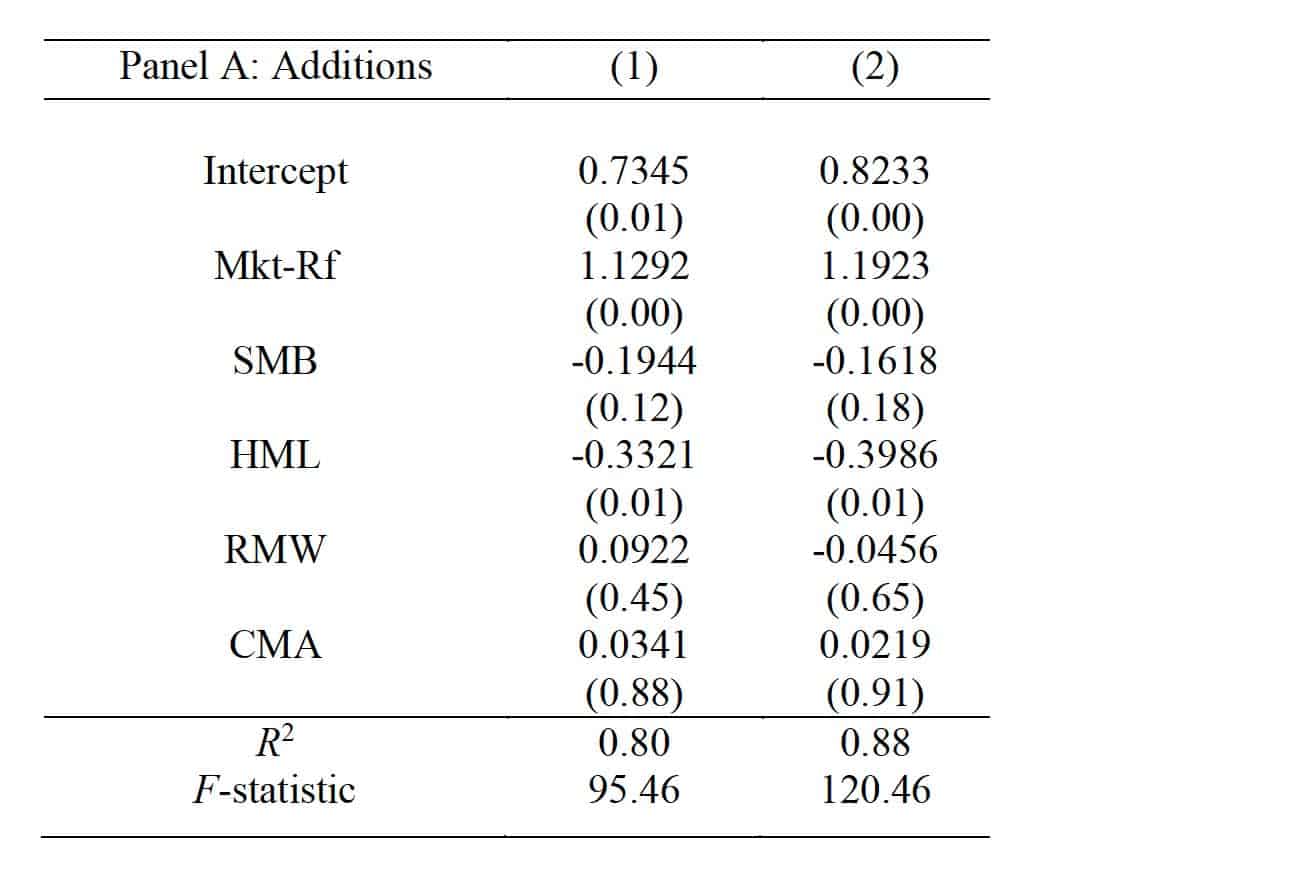
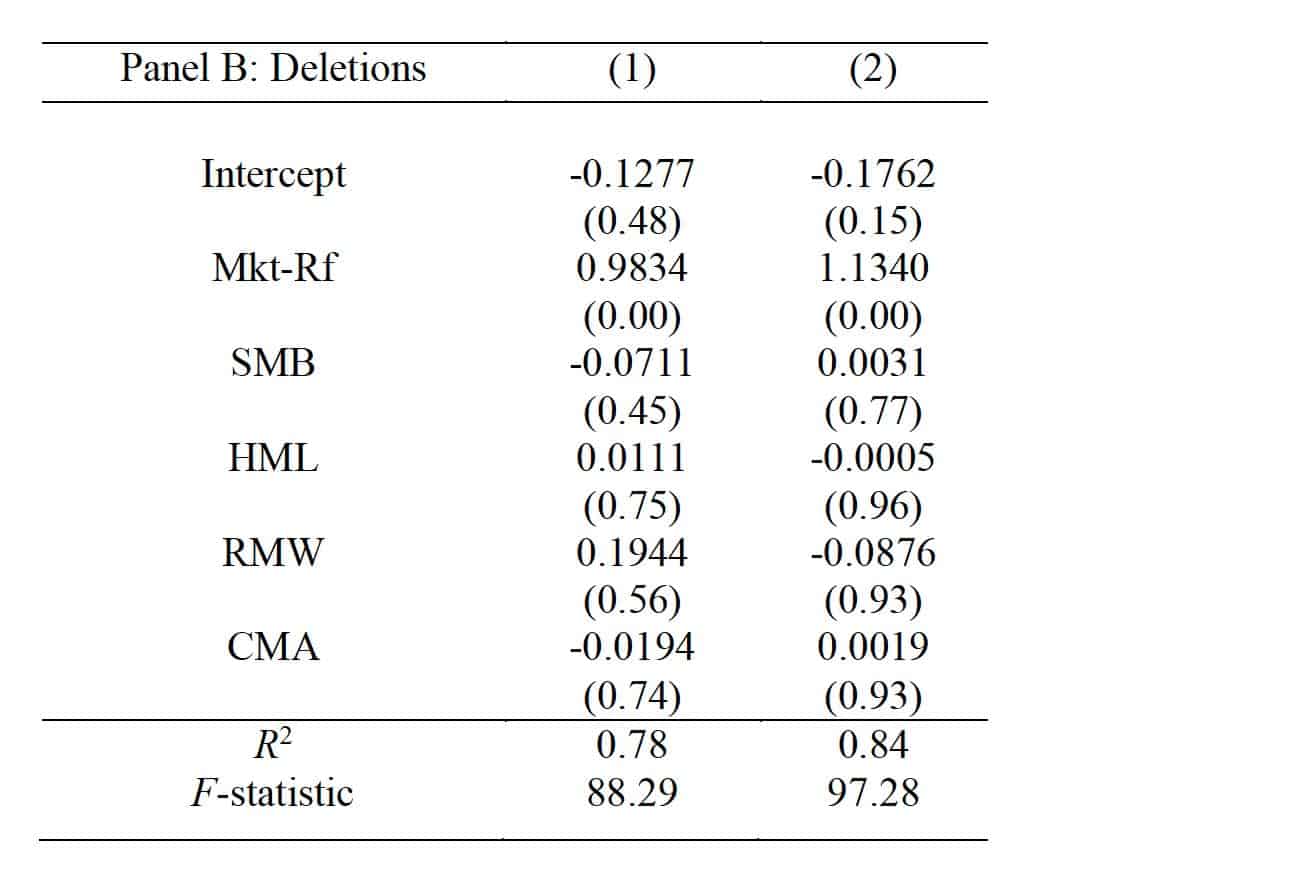
Table V presents the results for Additions and Deletions. In the time series, if a company is added to the Transparency list by improving its Transparency metrics, then it is added to the Additions portfolio in the subsequent year. If on the hand, a company drops in its transparency benchmarks, then it is added to the Deletions portfolio. Panel A presents the full sample of new additions to the Transparency portfolio. Portfolio B presents the full sample of deletions from the Transparency portfolio. Column (1) presents the results for the value-weighted portfolio and Column (2) presents the results for the equally-weighted portfolio.
Panel A highlights that the coefficient for the intercept term is positive and significant at the 1% level for both the value-weighted portfolio and for the equally-weighted portfolio. Panel B, which contains the deletions portfolio, highlights that the coefficient for the intercept term is not significant at the 1% level. Together the results highlight that Transparency additions to the portfolio may be driving the excess returns.
This paper details how transparency relates to firm prices. Considering various measures of transparency along cost disclosure, accountability, benchmarks, truth, terms of service, and trust, we find that firm transparency is positively associated with abnormal returns. The primary channels which these abnormal returns manifest is through the accountability, benchmarks and cost channels.
The results add to the existing literature on transparency and asset pricing by exploring previously unexplored measures of transparency. Whereas typically researchers use market micro-structure measures or firm-level indicators like intangible assets to capture firm-level transparency, the measures considered here look at firm transparency from the client or customer point of view and capture a far more in-depth understanding of what is a transparent firm.
In total, the results highlight that firm transparency does matter for returns. In particular transparency on cost, benchmarks and accountability, have the biggest and most appreciable effect on excess returns. Future studies into this line of research should explore how these forms of transparency directly link to firm improvements and the mechanism by which these returns come about.
This table reports summary statistics for the sample of 2355 portfolio-year observations from 2016 to 2020. The firm financial descriptive statistics for the Transparency portfolio in Panel A include: current assets ($MM), intangible assets ($MM), total assets ($MM), return on assets, price to earnings ratio, price to sales ratio, operating revenue growth (year over year), revenue growth (year over year), financial leverage, and market capitalization ($MM).. Panel B presents summary statistics for difference in means between the Transparency portfolio (Column (1)) and the non-Transparency portfolio (Column (2)). Panel C presents summary statistics for difference in medians between the Transparency portfolio (Column (1)) and the non-Transparency portfolio (Column (2)). Differences significant at the 5% level are denoted in bold.
Panel A: Firm Statistics | Mean | Median | 25th Percentile | 75th Percentile | Standard Deviation |
|---|---|---|---|---|---|
| Current Assets | 13600.41 | 2688.672 | 1137.816 | 9415.787 | 28809.88 |
| Intangible Assets | 6816.969 | 1324.579 | 408.614 | 8863.2 | 10843.72 |
| Total Assets | 36831.54 | 10837.64 | 2312 | 27298 | 79055.28 |
| Return on Assets | 3.415651 | 6.1511 | -2.4245 | 10.97145 | 13.26861 |
| Price/Earnings | 50.88573 | 34.93558 | 20.90601 | 61.48531 | 63.35356 |
| Price/Sales | 6.155916 | 3.68709 | 1.535888 | 7.702947 | 7.497349 |
| Operating Revenue Growth | 15.90592 | 15.27 | 5.67 | 27.4 | 28.07375 |
| Revenue Growth | 16.04817 | 15.27 | 5.67 | 27.91 | 28.07638 |
| Financial Leverage | 3.327966 | 2.3242 | 1.8138 | 3.2275 | 3.854906 |
| Market Capitalization | 62591.9 | 9508.586 | 3011.709 | 40977.17 | 173650.6 |
| Panel B: Difference in Means | Mean Transparent Portfolio | Mean Non- Transparent Portfolio | Difference |
|---|---|---|---|
| Current Assets | 13600.41 | 69298.92 | -55698.5 |
| Intangible Assets | 6816.969 | 11435.58 | -4618.61 |
| Total Assets | 36831.54 | 554139.6 | -517308 |
| Return on Assets | 3.415651 | -2.97687 | 6.392516 |
| Price/Earnings | 50.88573 | 62.80316 | -11.9174 |
| Price/Sales | 6.155916 | 16.49022 | -10.3343 |
| Operating Revenue Growth | 15.90592 | 33.22965 | -17.3237 |
| Revenue Growth | 16.04817 | 28.80745 | -12.7593 |
| Financial Leverage | 3.327966 | 3.866042 | -0.53808 |
| Market Capitalization | 62591.9 | 32732.94 | 29858.96 |
| Panel C: Difference in Medians | Median Transparent Portfolio | Median Non- Transparent Portfolio | Difference |
|---|---|---|---|
| Current Assets | 2688.672 | 1404.465 | 1284.207 |
| Intangible Assets | 1324.579 | 885.5365 | 439.0425 |
| Total Assets | 10837.64 | 3826.547 | 7011.092 |
| Return on Assets | 6.1511 | 3.4955 | 2.6556 |
| Price/Earnings | 34.93558 | 22.65947 | 12.2761 |
| Price/Sales | 3.68709 | 2.273533 | 1.413557 |
| Operating Revenue Growth | 15.27 | 7.425 | 7.845 |
| Revenue Growth | 15.27 | 7.445 | 7.825 |
| Financial Leverage | 2.3242 | 2.3109 | 0.0133 |
| Market Capitalization | 9508.586 | 3353.2 | 6155.386 |
This table reports results for correlations between individual transparency measures over the sample period. Panel A presents correlation statistics for all of the six measures: Benchmarks, Terms, Accountability, Cost, Truth and Trust. Panel B presents the correlation between various transparency measures and financial statistics in the sample (current assets ($MM), intangible assets ($MM), total assets ($MM), return on assets, price to earnings ratio, price to sales ratio, operating revenue growth (year over year), revenue growth (year over year), financial leverage, and market capitalization ($MM). Variables significant at the 5% level are denoted in bold.
| Panel A: Correlation of Factors | Benchmarks Score | Terms Score | Accountability Score | Cost Score | Truth score | Trust score |
|---|---|---|---|---|---|---|
| Standards Score | 1 | 0.191485 | -0.30174 | 0.327121 | -0.1495 | 0.146525 |
| Terms Score | 1 | -0.22655 | -0.09415 | 0.045595 | -0.16996 | |
| Accountability Score | 1 | 0.059005 | 0.073737 | -0.08627 | ||
| Cost Score | 1 | -0.47094 | 0.316544 | |||
| Truth Score | 1 | -0.10252 | ||||
| Trust Score | 1 |
| Panel B: Correlation of Factors to Financial Stats | Benchmarks Score | Terms Score | Accountability Score | Cost score | Truth score | Trust score |
|---|---|---|---|---|---|---|
| Current Assets | 0.027992 | 0.03819 | 0.275345 | 0.35674 | 0.071103 | 0.070808 |
| Intangible Assets | 0.13816 | -0.04744 | 0.217605 | 0.288437 | -0.02309 | -0.02345 |
| Total Assets | 0.076461 | -0.03367 | 0.233607 | 0.316581 | 0.060876 | 0.060553 |
| Return on Assets | -0.02965 | 0.072226 | 0.10817 | 0.234038 | -0.03531 | -0.06341 |
| Price/Earnings | 0.012711 | -0.03347 | 0.092793 | -0.05776 | -0.00563 | -0.00563 |
| Price/Sales | 0.018666 | -0.04073 | -0.07046 | 0.009486 | 0.016083 | 0.015975 |
| Op Revenue Growth | -0.12302 | 0.119643 | -0.03679 | 0.303339 | 0.011588 | 0.278892 |
| Revenue Growth | -0.12363 | 0.122982 | -0.03226 | 0.302098 | 0.02362 | 0.277896 |
| Financial Leverage | -0.05921 | -0.02996 | -0.02468 | -0.05677 | -0.01346 | -0.0139 |
| Market Capitalization | 0.105269 | -0.05021 | 0.273097 | 0.310005 | 0.194377 | 0.194192 |
This table reports results for a series of Fama-French 5-Factor time series regressions for 2355 portfolio-year observations from 2016 to 2020. The dependent variable in all regressions is the monthly return for a given portfolio. The independent variables are the Fama-French five factors: Mkt-Rf, SMB, HML, RMW, CMA (all monthly observations). Panel A presents the full sample where all portfolios are value-weighted. Panel B presents the full results where all portfolios are equally-weighted. Column (1) presents the results for the Transparency portfolio. Column (2) presents the results for the non-Transparency portfolio. Column (3) presents the results for the neutral portfolio (Transparent minus non-Transparent). Standard errors are computed using robust methods and p-values are reported below coefficients in parentheses.
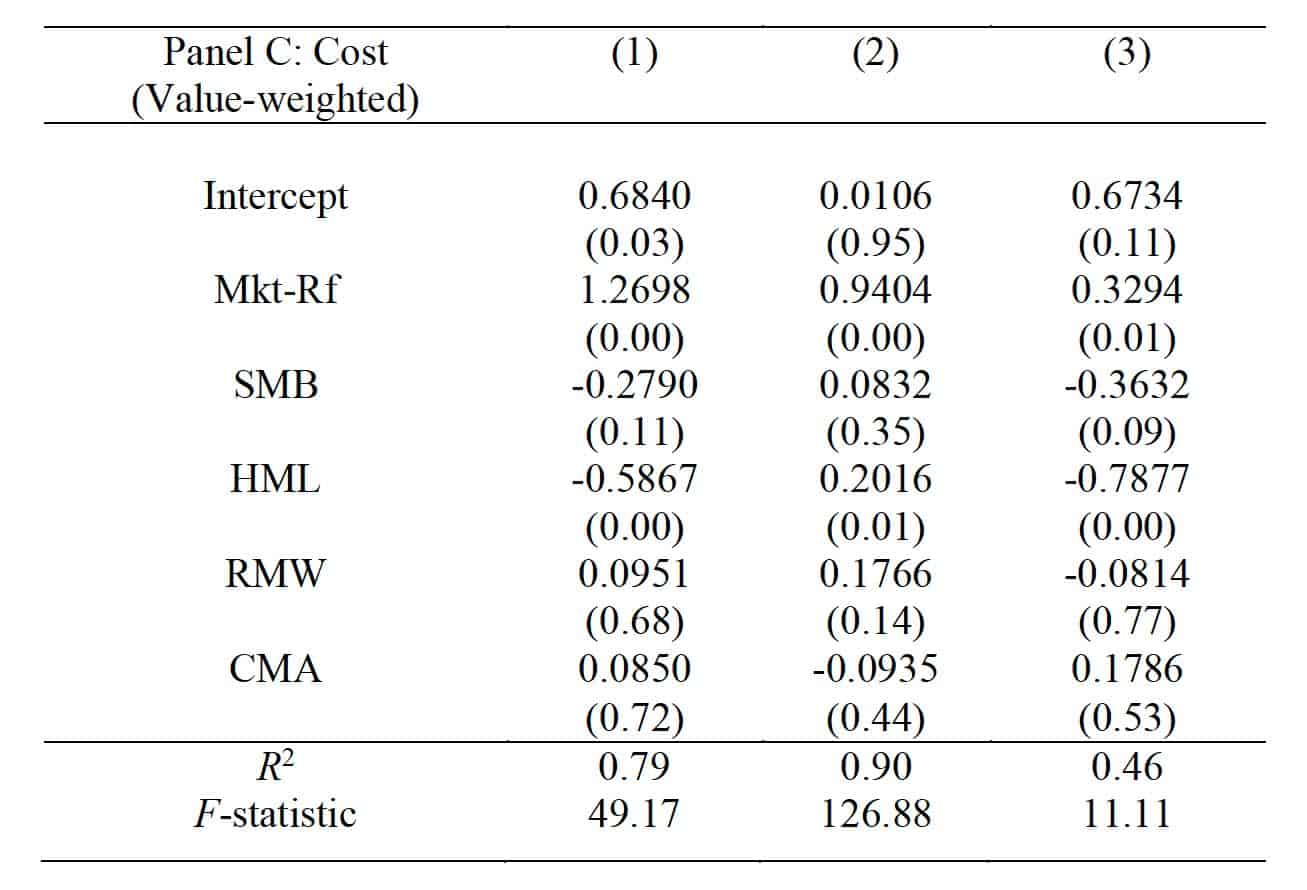
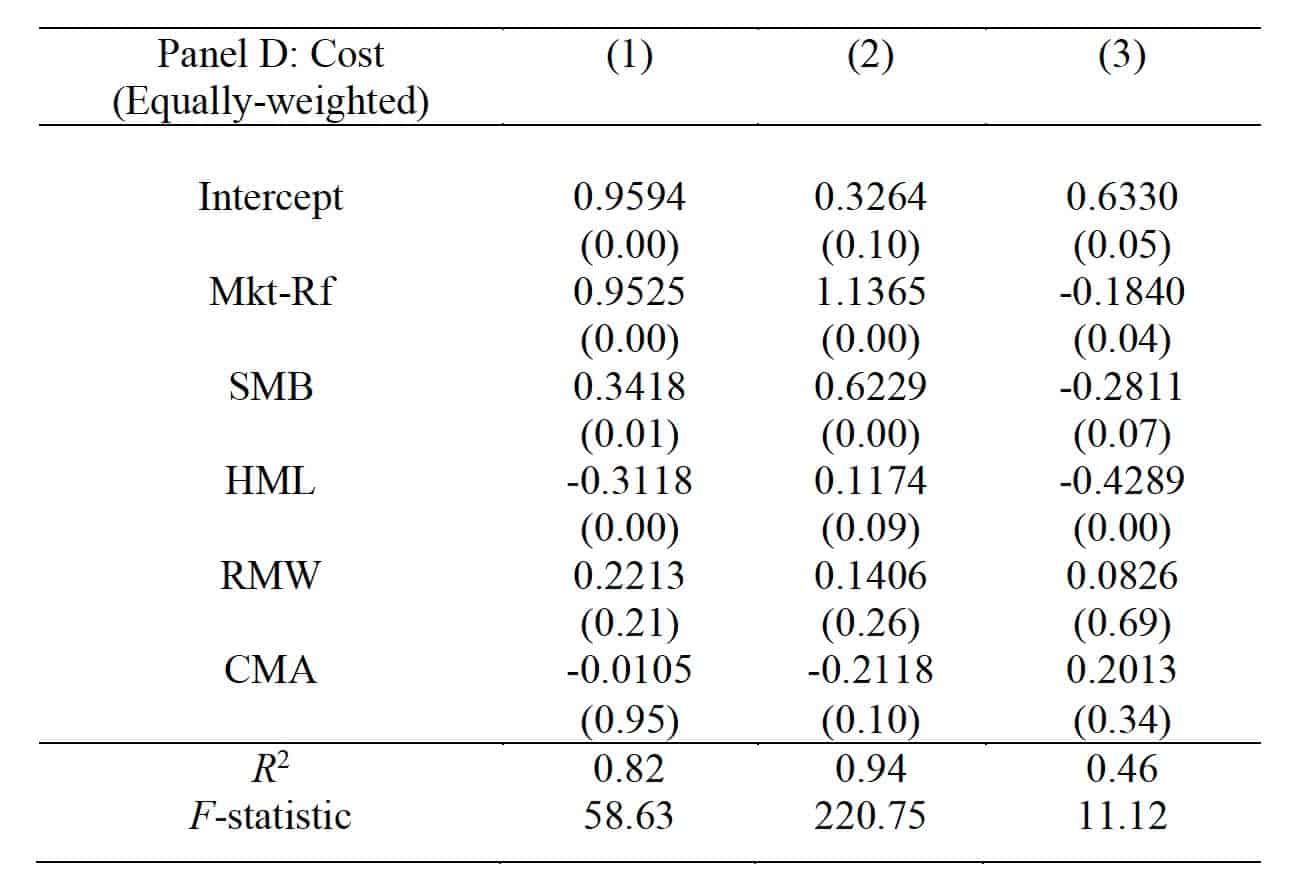
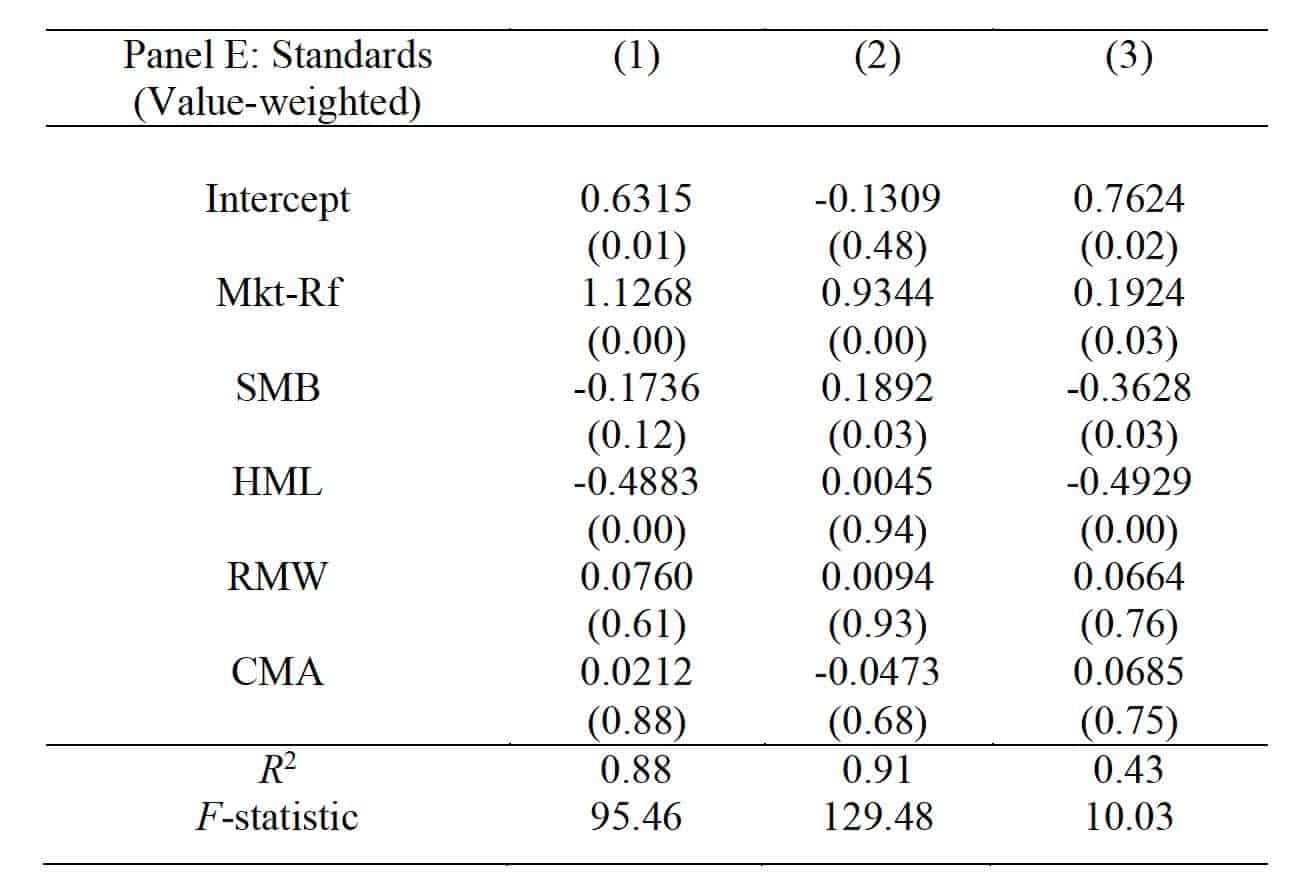
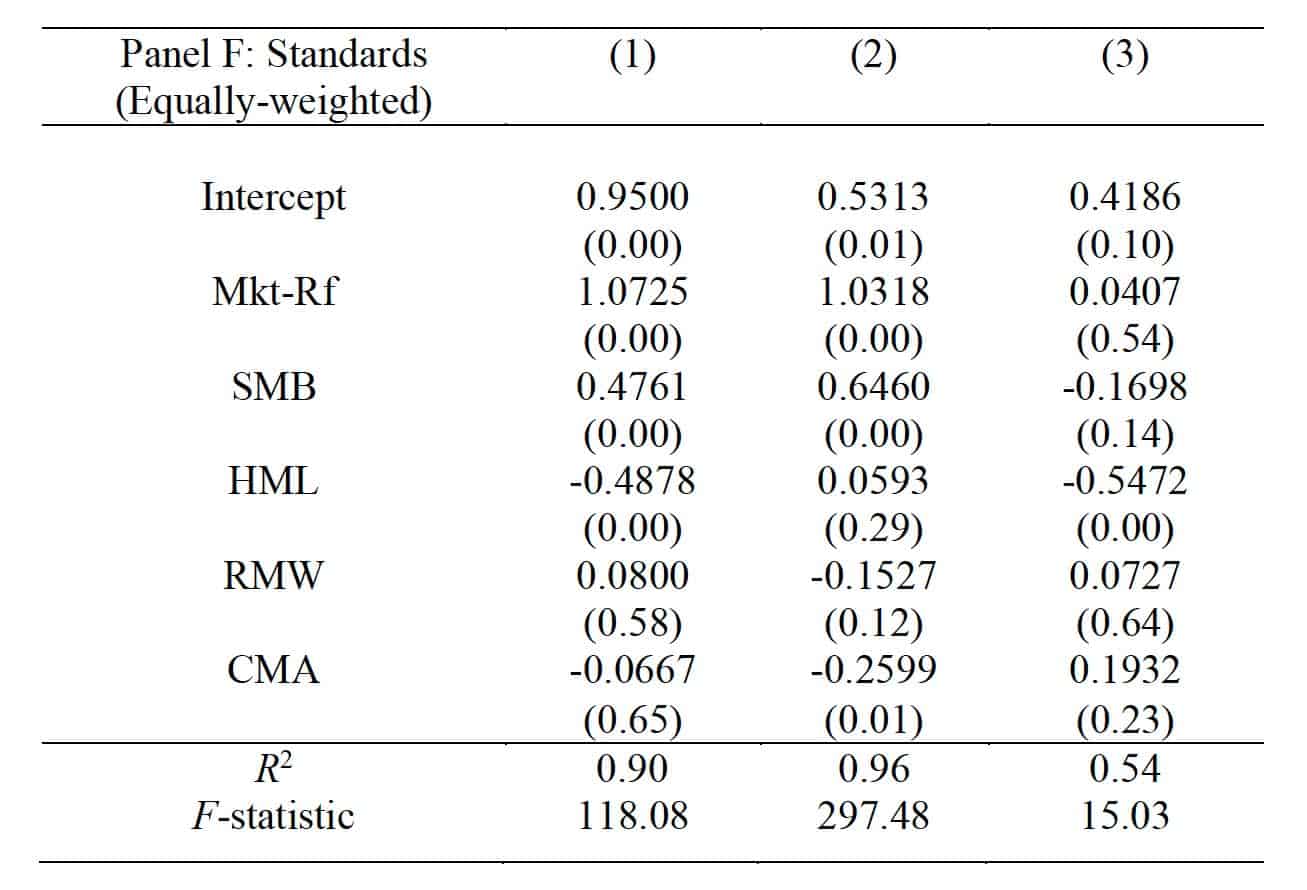
This table reports results for a series of Fama-French 5-Factor time series regressions for 2355 portfolio-year observations from 2016 to 2020. The dependent variable in all regressions is the monthly return for a given portfolio. The independent variables are the Fama-French five factors: Mkt-Rf, SMB, HML, RMW, CMA (all monthly observations). Panel A-B presents the results for the Accountability portfolio, Panel C-D presents the results for the Cost portfolio, Panel E-F presents the results for the Benchmarks portfolio, Panel G-H presents the results for the Terms portfolio, Panel I-J presents the results for the Trust portfolio, and Panel K-L presents the results for the Truth portfolio. Column (1) presents the results for the Transparency portfolio. Column (2) presents the results for the non-Transparency portfolio. Column (3) presents the results for the neutral portfolio (Transparent minus non-Transparent). Standard errors are computed using robust methods and p-values are reported below coefficients in parentheses.

This table reports results for a series of Fama-French 5-Factor time series regressions for 2355 portfolio-year observations from 2016 to 2020. The dependent variable in all regressions is the monthly return for a given portfolio. The independent variables are the Fama-French five factors: Mkt-Rf, SMB, HML, RMW, CMA (all monthly observations). Panel A presents the full sample of new additions to the Transparency portfolio. Portfolio B presents the full sample of deletions from the Transparency portfolio. Column (1) presents the results for the value-weighted portfolio and Column (2) presents the results for the equally- weighted portfolio. Standard errors are computed using robust methods and p-values are reported below coefficients in parentheses.
Dr. Derek Horstmeyer
School of Business, George Mason University
I appreciate the helpful comments from Dr. Rainford Knight, Ano Glonti, Paul Pagnato and the faculty at George Mason University. Contact the author at School of Business, George Mason University, 4400 University Drive, Fairfax, VA 22030; fax: 703-993-1867, tel: 650-862-9582, email: dhorstme@gmu.edu.
In this paper, we address how firm transparency relates to equity returns. Considering various measures of transparency along cost disclosure, accountability, standards, truth, terms of service, and trust dimensions, we find that firm transparency is positively associated with firm risk-adjusted returns. The primary channels by which these abnormal returns manifest is through the accountability, standards and cost channels. We then explore how these transparency measures relate to firm financial measures like operating revenue growth, and other variables known to be associated with long-term returns.
The question of whether firm transparency is positively associated with excess performance or negatively associated with excess performance is still an open question. On one hand, practitioners often argue that a firm needs to protect its secrets from its competitors and therefore needs to maintain a level of information asymmetry between them and their customers/clients in order to deliver superior performance to shareholders.
Yet, firm transparency may also be value adding in its ability to attract capital and support investor interest via the reduction in asymmetric information. Investors and clients may feel more confident in dealing with a company that is transparent in its protocols, accounting, standards and costs since this level of transparency could signal a lower probability of financial distress.1
We decided to tackle this exact question – how does firm-level transparency relate to asset returns and by which channels do these returns manifest? Using proprietary data provided by Transparency Invest™, we examine firm transparency along six distinct dimensions (accountability, standards, trust, truth, terms and cost) and find that transparency is associated with abnormal returns and performance. The estimates of abnormal returns average 50 basis points per month, which yields an abnormal return of over 6 percentage points per annum. These results hold after controlling for other factors known to influence firm returns (namely the Fama-French 5 factor model). In addition, we find that the primary channel that these excess returns manifest are through the accountability, standards and cost transparency variables.
We then explore how these factors relate to other firm-level statistics that are associated with long-run firm success. In particular we find that transparent firms are associated with stronger revenue growth and this primarily plays out through the cost and trust channels.
This work adds to an existing literature on transparency and firm returns in that it is the first to use direct measures of firm transparency to address the issue of excess returns. Past work looking at firm transparency has focused on market micro-structure measures of transparency (Easley and O’Hara (2004), Gu et al. (2021)) or have limited their scope to public accounting measures like intangible assets or volatility of performance to capture information asymmetry at the firm level (Armstrong et al. (2014)).2 While these past measures do capture some aspect of firm transparency, the work detailed here is the first to look at firm transparency directly – examining the direct relationship between the firm and the investor and capturing the degree to which the investor knows about the costs they are paying, the standards of the firm, the terms they are agreeing to, and the degree to which the company is trustworthy.
This paper proceeds as follows: Section II presents the data construction and summary statistics. Section III presents the empirical methodology and results. Section IV concludes the paper.
In the proceeding section, we summarize the data construction, detail all variables that are used in the study and provide summary statistics including correlation among variables of interest.
First, the six primary transparency variables come from Transparency Invest™ . To develop their transparency measures, the firm starts with the entire universe of publicly traded primary securities in the world. The starting number of securities are 58,708 securities that are across all the exchanges including: Latin America, Europe, and Asia’s exchanges.
Next, initial screens are implemented to construct the initial pool of potential firms: first, global companies with listed common stock and ADRs traded on US exchanges are considered for analysis. In addition, the ESG exclusionary method is applied to remove 9 industries due to negative impact on in- vestment performance and the well-being of people. These industries are: Alcohol, Banking, Chemicals, Confectionary, Fossil Fuel Transportation, Gambling, Metals & Mining, Oil & Natural Gas and Tobacco. Next, each firm must have a minimum market cap of 1 billion and have recorded revenue. Finally, companies without corporate websites are excluded from consideration. This initial screening makes up the potential dataset from which the Transparency portfolios and non-Transparency portfolios are formed.
Following the establishment of these companies that make the cut, six transparency measures are captured for each firm in time-series:
For each of the six individual Transparency measures, a score of 1 to 5 is given to a given firm. Adding these up over the six factors, a firm will be allocated to the ‘Transparent portfolio’ if their six factors add up to over 60% (18 out of 30 for firms that have available scores for all six factors). This delineation captures the top quintile of firms. All other firms that score below 60% will be allocated to the ‘non-Transparent portfolio’.
In addition, from Compustat and Morningstar Direct we access the following firm-specific information necessary for the analysis: current assets ($MM), intangible assets ($MM), total assets ($MM), return on assets, price to earnings ratio, price to sales ratio, operating revenue growth (year over year), revenue growth (year over year), financial leverage, and market capitalization ($MM). All return data for portfolios and individual firms is pulled from CRSP. All control variables needed for the Fama-French five factor models is accessed from the Ken French’s website. All variables constructed are windsorized throughout at the 1% level.
First, it is important to detail how firm transparency measures relate to firm characteristics. Table I reports summary statistics for the sample of 2355 portfolio-year observations from 2016 to 2020. The firm financial descriptive statistics for the Transparency portfolio in Panel A include: current assets ($MM), intangible assets ($MM), total assets ($MM), return on assets, price to earnings ratio, price to sales ratio, operating revenue growth (year over year), revenue growth (year over year), financial leverage, and market capitalization ($MM). Panel B presents summary statistics for difference in means between the Transparency portfolio (Column (1)) and the non-Transparency portfolio (Column (2)). Panel C presents summary statistics for difference in medians between the Transparency portfolio (Column (1)) and the non-Transparency portfolio (Column (2)).3
The first salient feature of the data is that the average firm in the Transparency portfolio is larger in terms of market cap and total assets and has a great valuation (P/E ratio) as compared to the average firm in the non-Transparency portfolio (all differences of medians significant at the 5% level). In addition, it is interesting to note that there is not significant differences in revenue growth measures between the two samples.
Table II reports results for correlations between individual transparency measures over the sample period. Panel A presents correlation statistics for all of the six measures: Standards, Terms, Accountability, Cost, Truth and Trust. Panel B presents the correlation between various transparency measures and financial statistics in the sample (current assets ($MM), intangible assets ($MM), total assets ($MM), return on assets, price to earnings ratio, price to sales ratio, operating revenue growth (year over year), revenue growth (year over year), financial leverage, and market capitalization ($MM).
Panel A of Table II highlights that Accountability is slightly negatively correlated with both Standards and Terms. Next, Cost is negatively correlated with Truth and Trust (all significant differences at the 5% level).
Panel B of Table II demonstrates that Accountable firms and those that score well for the Cost variable are larger in terms of total assets and market cap. Firms that score higher on Truth and Trust are also larger firms but only in terms of market cap. Next, firms that score well on Cost and Trust are associated with greater revenue growth (significant at the 5% level).
In the following section, we detail the relationship between Transparency and asset returns. First, we detail how Transparency measures relate to returns on an unadjusted basis. Then we detail the relationship adjusting for factors we know affect long-run returns. Finally, we examine individual components of the Transparency measure to assess which factors are driving the returns.
Chart I highlights the cumulative returns to the Transparency portfolio, the non-Transparency portfolio and the S&P 500 between 2016 and 2021. The initial position of each portfolio is indexed to a dollar. On a value-weighted basis, the Transparent portfolio has a final balance of 4.40 while the non-Transparent portfolio has a final balance of 2.50. On an equally-weighted basis, the Transparent portfolio has a final balance of 5.33 while the non-Transparent portfolio has a final balance of 3.48.
Next, Chart I also denotes the cumulative returns to the six Transparency factors isolated by themselves. Over the 2016 to 2021 time period, the Trust factor does best in terms of returns on a value-weighted portfolio basis while the Truth factor does worst. On an equally-weighted portfolio basis, the Trust factor again does best while the Terms factor does worst.
Table III addresses the issue of excess returns but adjusting for factors that are known to affect returns. To adjust for these factors we run the Fama-French 5 (FF 5) factor model:
Rett = α + βMktRMkt−Rf + βSMBRSMB + βHMLRHML + βRMW RRMW + βCMARCMA
The FF 5 factor regression is run on each Transparency portfolio over the time period (monthly returns). Mkt-Rf, the excess return on the market, value-weight return of all CRSP firms incorporated in the US and listed on the NYSE, AMEX, or NASDAQ. SMB (Small Minus Big) is the average return on the nine small stock portfolios minus the average return on the nine big stock portfolios. HML (High Minus Low) is the average return on the two value portfolios minus the average return on the two growth portfolios. RMW (Robust Minus Weak) is the average return on the two robust operating profitability portfolios minus the average return on the two weak operating profitability portfolios. CMA (Conservative Minus Aggressive) is the average return on the two conservative investment portfolios minus the average return on the two aggressive investment portfolios.
Table III Panel A presents the results for a series of Fama-French 5-Factor time series regressions where all portfolios are value-weighted. Panel B presents the full results where all portfolios are equally- weighted. Column (1) presents the results for the Transparent portfolio. Column (2) presents the results for the non-Transparent portfolio. Column (3) presents the results for the neutral portfolio (Transparent minus non-Transparent. Standard errors are computed using robust methods and p-values are reported below coefficients in parentheses.
The first interesting finding is that in Panel A Column (1) the excess return coefficient is 0.4947 and is significant at the 5% level. This indicates an excess return of nearly 50 basis points per month once adjusting for all pricing factors. In Panel B Column (2) we can see no significant coefficient on the same excess return statistic for the non-Transparent regression. Next it is important to note the coefficients on the market return factor and the HML factor. In Column (1) the market return coefficient is 1.2276 and is significant at the 1% level and the coefficient on the HML factor is -0.5522 which is again significant at the 1% level. This indicates that our Transparent portfolio has significant market risk and is titled toward growth companies (low book-to-market companies).
In Column (3) of Panel A we run a ‘neutral’ regression where the returns to the non-Transparent portfolio are subtracted from Transparent portfolio each month. Again we see similar results here in terms of excess returns. The intercept in this regression is 0.4252 (significant at the 5% level) which indicates a 42 basis per month excess return on a market neutral portfolio. Panel B presents results where an equally weighted portfolio is used and again qualitatively similar results hold throughout.
In Table IV we explore the returns to individual Transparency factors. Panel A-B presents the results for the Accountability portfolio, Panel C-D presents the results for the Cost portfolio, Panel E-F presents the results for the Standards portfolio, Panel G-H presents the results for the Terms portfolio, Panel I-J presents the results for the Trust portfolio, and Panel K-L presents the results for the Truth portfolio. All individual portfolios are formed by taking firms that score a 4 or 5 on a particular factor as being included in the portfolio. All firms that score a 1 or 2 on a particular factor are allocated to the ‘Non’ portfolio. So for instance if a firm scores a 4 on Accountability, it will be allocated to the Accountability portfolio. If a firms scores a 2 on Accountability, it will be allocated to the ‘non-Accountability’ portfolio.
Panel A of Table IV highlights the results for the Accountability measure. Column (1) presents the results for the Accountability portfolio. Column (2) presents the results for the non-Accountability portfolio. Column (3) presents the results for the neutral portfolio (Accountability minus non-Accountability).
Similarly to the results in Table III, in Column (1) and Column (3) we can see a positive and significant intercept term. This indicates that on an unadjusted basis and on a market neutral basis, the Accountability portfolio is generating an average of 68 basis points in excess returns per month (FF 5 factor adjusted – average of Column (1) and Column (3)). This excess return result holds in Panel B where the results are presented on an equally weighted basis.
Examining the other individual Transparency measures we see similar positive and significant intercept terms for Cost (Panel C and D), and for Standards (Panel E and F). But the positive and significant intercept terms fail to manifest for the other panels presented for Terms, Trust and Truth. These results highlight the primary channel by which the excess returns noted in Table III are being transmitted through the Cost, Accountability and Standards measures of Transparency.
Table V presents the results for Additions and Deletions. In the time series, if a company is added to the Transparency list by improving its Transparency metrics, then it is added to the Additions portfolio in the subsequent year. If on the hand, a company drops in its transparency standards, then it is added to the Deletions portfolio. Panel A presents the full sample of new additions to the Transparency portfolio. Portfolio B presents the full sample of deletions from the Transparency portfolio. Column (1) presents the results for the value-weighted portfolio and Column (2) presents the results for the equally-weighted portfolio.
Panel A highlights that the coefficient for the intercept term is positive and significant at the 1% level for both the value-weighted portfolio and for the equally-weighted portfolio. Panel B, which contains the deletions portfolio, highlights that the coefficient for the intercept term is not significant at the 1% level. Together the results highlight that Transparency additions to the portfolio may be driving the excess returns.
This paper details how transparency relates to firm prices. Considering various measures of transparency along cost disclosure, accountability, standards, truth, terms of service, and trust, we find that firm transparency is positively associated with abnormal returns. The primary channels which these abnormal returns manifest is through the accountability, standards and cost channels.
The results add to the existing literature on transparency and asset pricing by exploring previously unexplored measures of transparency. Whereas typically researchers use market micro-structure measures or firm-level indicators like intangible assets to capture firm-level transparency, the measures considered here look at firm transparency from the client or customer point of view and capture a far more in-depth understanding of what is a transparent firm.
In total, the results highlight that firm transparency does matter for returns. In particular transparency on cost, standards and accountability, have the biggest and most appreciable effect on excess returns. Future studies into this line of research should explore how these forms of transparency directly link to firm improvements and the mechanism by which these returns come about.
This table reports summary statistics for the sample of 2355 portfolio-year observations from 2016 to 2020. The firm financial descriptive statistics for the Transparency portfolio in Panel A include: current assets ($MM), intangible assets ($MM), total assets ($MM), return on assets, price to earnings ratio, price to sales ratio, operating revenue growth (year over year), revenue growth (year over year), financial leverage, and market capitalization ($MM).. Panel B presents summary statistics for difference in means between the Transparency portfolio (Column (1)) and the non-Transparency portfolio (Column (2)). Panel C presents summary statistics for difference in medians between the Transparency portfolio (Column (1)) and the non-Transparency portfolio (Column (2)). Differences significant at the 5% level are denoted in bold.
Panel A: Firm Statistics | Mean | Median | 25th Percentile | 75th Percentile | Standard Deviation |
|---|---|---|---|---|---|
| Current Assets | 13600.41 | 2688.672 | 1137.816 | 9415.787 | 28809.88 |
| Intangible Assets | 6816.969 | 1324.579 | 408.614 | 8863.2 | 10843.72 |
| Total Assets | 36831.54 | 10837.64 | 2312 | 27298 | 79055.28 |
| Return on Assets | 3.415651 | 6.1511 | -2.4245 | 10.97145 | 13.26861 |
| Price/Earnings | 50.88573 | 34.93558 | 20.90601 | 61.48531 | 63.35356 |
| Price/Sales | 6.155916 | 3.68709 | 1.535888 | 7.702947 | 7.497349 |
| Operating Revenue Growth | 15.90592 | 15.27 | 5.67 | 27.4 | 28.07375 |
| Revenue Growth | 16.04817 | 15.27 | 5.67 | 27.91 | 28.07638 |
| Financial Leverage | 3.327966 | 2.3242 | 1.8138 | 3.2275 | 3.854906 |
| Market Capitalization | 62591.9 | 9508.586 | 3011.709 | 40977.17 | 173650.6 |
| Panel B: Difference in Means | Mean Transparent Portfolio | Mean Non- Transparent Portfolio | Difference |
|---|---|---|---|
| Current Assets | 13600.41 | 69298.92 | -55698.5 |
| Intangible Assets | 6816.969 | 11435.58 | -4618.61 |
| Total Assets | 36831.54 | 554139.6 | -517308 |
| Return on Assets | 3.415651 | -2.97687 | 6.392516 |
| Price/Earnings | 50.88573 | 62.80316 | -11.9174 |
| Price/Sales | 6.155916 | 16.49022 | -10.3343 |
| Operating Revenue Growth | 15.90592 | 33.22965 | -17.3237 |
| Revenue Growth | 16.04817 | 28.80745 | -12.7593 |
| Financial Leverage | 3.327966 | 3.866042 | -0.53808 |
| Market Capitalization | 62591.9 | 32732.94 | 29858.96 |
| Panel C: Difference in Medians | Median Transparent Portfolio | Median Non- Transparent Portfolio | Difference |
|---|---|---|---|
| Current Assets | 2688.672 | 1404.465 | 1284.207 |
| Intangible Assets | 1324.579 | 885.5365 | 439.0425 |
| Total Assets | 10837.64 | 3826.547 | 7011.092 |
| Return on Assets | 6.1511 | 3.4955 | 2.6556 |
| Price/Earnings | 34.93558 | 22.65947 | 12.2761 |
| Price/Sales | 3.68709 | 2.273533 | 1.413557 |
| Operating Revenue Growth | 15.27 | 7.425 | 7.845 |
| Revenue Growth | 15.27 | 7.445 | 7.825 |
| Financial Leverage | 2.3242 | 2.3109 | 0.0133 |
| Market Capitalization | 9508.586 | 3353.2 | 6155.386 |
This table reports results for correlations between individual transparency measures over the sample period. Panel A presents correlation statistics for all of the six measures: Standards, Terms, Accountability, Cost, Truth and Trust. Panel B presents the correlation between various transparency measures and financial statistics in the sample (current assets ($MM), intangible assets ($MM), total assets ($MM), return on assets, price to earnings ratio, price to sales ratio, operating revenue growth (year over year), revenue growth (year over year), financial leverage, and market capitalization ($MM). Variables significant at the 5% level are denoted in bold.
| Panel A: Correlation of Factors | Standards Score | Terms Score | Accountability Score | Cost Score | Truth score | Trust score |
|---|---|---|---|---|---|---|
| Standards Score | 1 | 0.191485 | -0.30174 | 0.327121 | -0.1495 | 0.146525 |
| Terms Score | 1 | -0.22655 | -0.09415 | 0.045595 | -0.16996 | |
| Accountability Score | 1 | 0.059005 | 0.073737 | -0.08627 | ||
| Cost Score | 1 | -0.47094 | 0.316544 | |||
| Truth Score | 1 | -0.10252 | ||||
| Trust Score | 1 |
| Panel B: Correlation of Factors to Financial Stats | Standards Score | Terms Score | Accountability Score | Cost score | Truth score | Trust score |
|---|---|---|---|---|---|---|
| Current Assets | 0.027992 | 0.03819 | 0.275345 | 0.35674 | 0.071103 | 0.070808 |
| Intangible Assets | 0.13816 | -0.04744 | 0.217605 | 0.288437 | -0.02309 | -0.02345 |
| Total Assets | 0.076461 | -0.03367 | 0.233607 | 0.316581 | 0.060876 | 0.060553 |
| Return on Assets | -0.02965 | 0.072226 | 0.10817 | 0.234038 | -0.03531 | -0.06341 |
| Price/Earnings | 0.012711 | -0.03347 | 0.092793 | -0.05776 | -0.00563 | -0.00563 |
| Price/Sales | 0.018666 | -0.04073 | -0.07046 | 0.009486 | 0.016083 | 0.015975 |
| Op Revenue Growth | -0.12302 | 0.119643 | -0.03679 | 0.303339 | 0.011588 | 0.278892 |
| Revenue Growth | -0.12363 | 0.122982 | -0.03226 | 0.302098 | 0.02362 | 0.277896 |
| Financial Leverage | -0.05921 | -0.02996 | -0.02468 | -0.05677 | -0.01346 | -0.0139 |
| Market Capitalization | 0.105269 | -0.05021 | 0.273097 | 0.310005 | 0.194377 | 0.194192 |
This table reports results for a series of Fama-French 5-Factor time series regressions for 2355 portfolio-year observations from 2016 to 2020. The dependent variable in all regressions is the monthly return for a given portfolio. The independent variables are the Fama-French five factors: Mkt-Rf, SMB, HML, RMW, CMA (all monthly observations). Panel A presents the full sample where all portfolios are value-weighted. Panel B presents the full results where all portfolios are equally-weighted. Column (1) presents the results for the Transparency portfolio. Column (2) presents the results for the non-Transparency portfolio. Column (3) presents the results for the neutral portfolio (Transparent minus non-Transparent). Standard errors are computed using robust methods and p-values are reported below coefficients in parentheses.
This table reports results for a series of Fama-French 5-Factor time series regressions for 2355 portfolio-year observations from 2016 to 2020. The dependent variable in all regressions is the monthly return for a given portfolio. The independent variables are the Fama-French five factors: Mkt-Rf, SMB, HML, RMW, CMA (all monthly observations). Panel A-B presents the results for the Accountability portfolio, Panel C-D presents the results for the Cost portfolio, Panel E-F presents the results for the Standards portfolio, Panel G-H presents the results for the Terms portfolio, Panel I-J presents the results for the Trust portfolio, and Panel K-L presents the results for the Truth portfolio. Column (1) presents the results for the Transparency portfolio. Column (2) presents the results for the non-Transparency portfolio. Column (3) presents the results for the neutral portfolio (Transparent minus non-Transparent). Standard errors are computed using robust methods and p-values are reported below coefficients in parentheses.
This table reports results for a series of Fama-French 5-Factor time series regressions for 2355 portfolio-year observations from 2016 to 2020. The dependent variable in all regressions is the monthly return for a given portfolio. The independent variables are the Fama-French five factors: Mkt-Rf, SMB, HML, RMW, CMA (all monthly observations). Panel A presents the full sample of new additions to the Transparency portfolio. Portfolio B presents the full sample of deletions from the Transparency portfolio. Column (1) presents the results for the value-weighted portfolio and Column (2) presents the results for the equally- weighted portfolio. Standard errors are computed using robust methods and p-values are reported below coefficients in parentheses.

Dr. Horstmeyer is a full professor at George Mason University School of Business, specializing in corporate finance. His research, which has garnered several awards, focuses on boards, governance and hedge fund activism. He is a monthly contributor to the Wall Street Journal, oversees the GMU Student Managed Investment fund, serves as Director of the new Financial Planning & Wealth Management major at GMU, and is consistently rated a top professor by his undergraduate/MBA/EMBA students who have honored him with several teaching awards.
Derek has a BS in Mathematics and Economics from the University of Chicago, an MS in Financial Mathematics from Stanford University and a PhD in Finance from the USC Marshall School of Business.